Overview
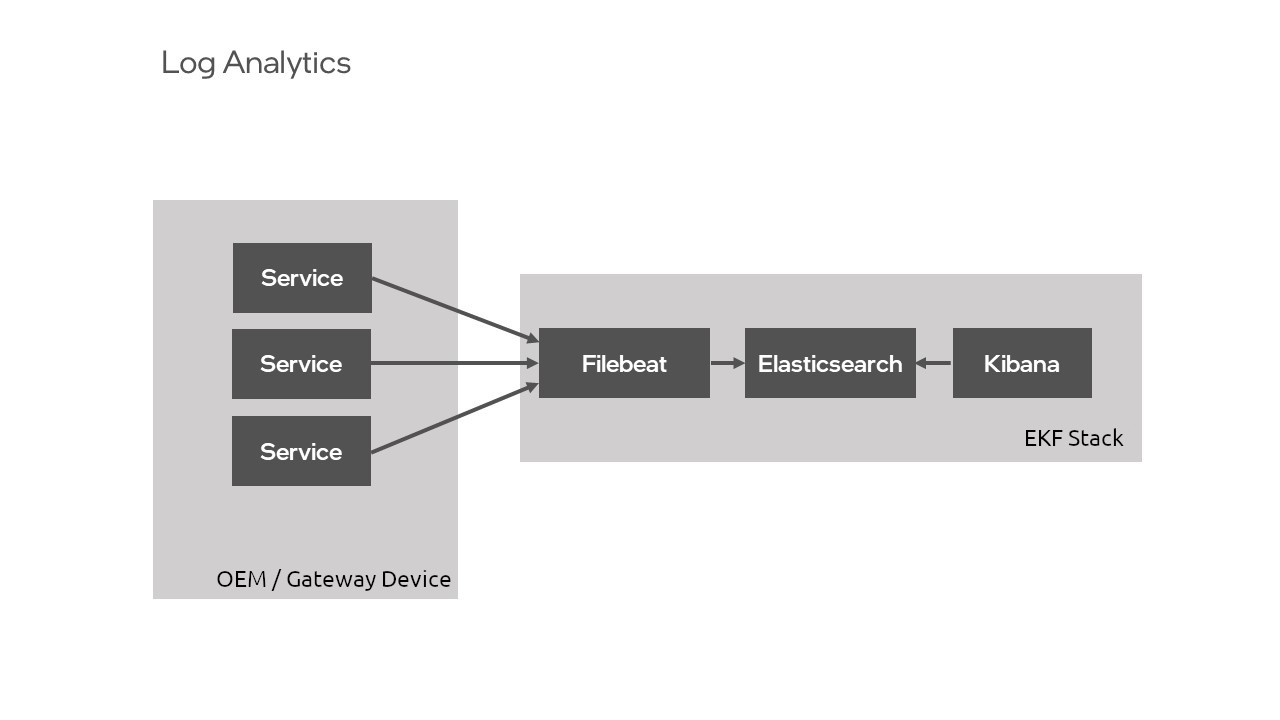
The open-source tools, Elasticsearch, Logstash, and Kibana (ELK), comprise the ELK stack, a tech stack commonly used for log analytics. AiCSD implements a variation of the ELK tech stack for its container and service logs, replacing Logstash with the use of Filebeat.
Figure 1 illustrates the data flow and component relationships in the stack.
Architecture
Note
It isn't necessary to download the tools of the ELK stack separately as they are included in the log analytics feature of AiCSD. However, to find out more about each tool, see the Resources section for each of the tools.
Enable Log Analytics
To enable log analytics services, update authentication information in the .env file found within the root directory, as described in Run the Services.
Note
While some out-of-the-box security measures were taken for the single-user environment, this repository contains the base implementation for log analytics. It is not configured for complex projects or deployment-specific security concerns.
Run the Services
To update the authentication information in the .env file:
- Open up
.envfound at the root level of this project. - Scroll down to the bottom of the file to the
Log analyticssection. - Find the
ELASTIC_PASSWORDvariable and update the value with a password at least 8 characters in length. Be sure to remove the<>characters. - Find the
KIBANA_SYSTEM_PASSWORDvariable and update the value with a password at least 8 characters in length. Be sure to remove the<>characters. -
Start Elasticsearch, Filebeat, and Kibana:
make run-log-analyticsThis command creates a
log-analyticsdocker network and bring up the services necessary for these purposes.
View Log Analytics
To view the log analytics within the Kibana UI, visit: http://localhost:5601.
To best navigate the Kibana UI, follow these next steps:
-
Log in using the
elasticusername and theELASTIC_PASSWORDthat was set in the.envfile.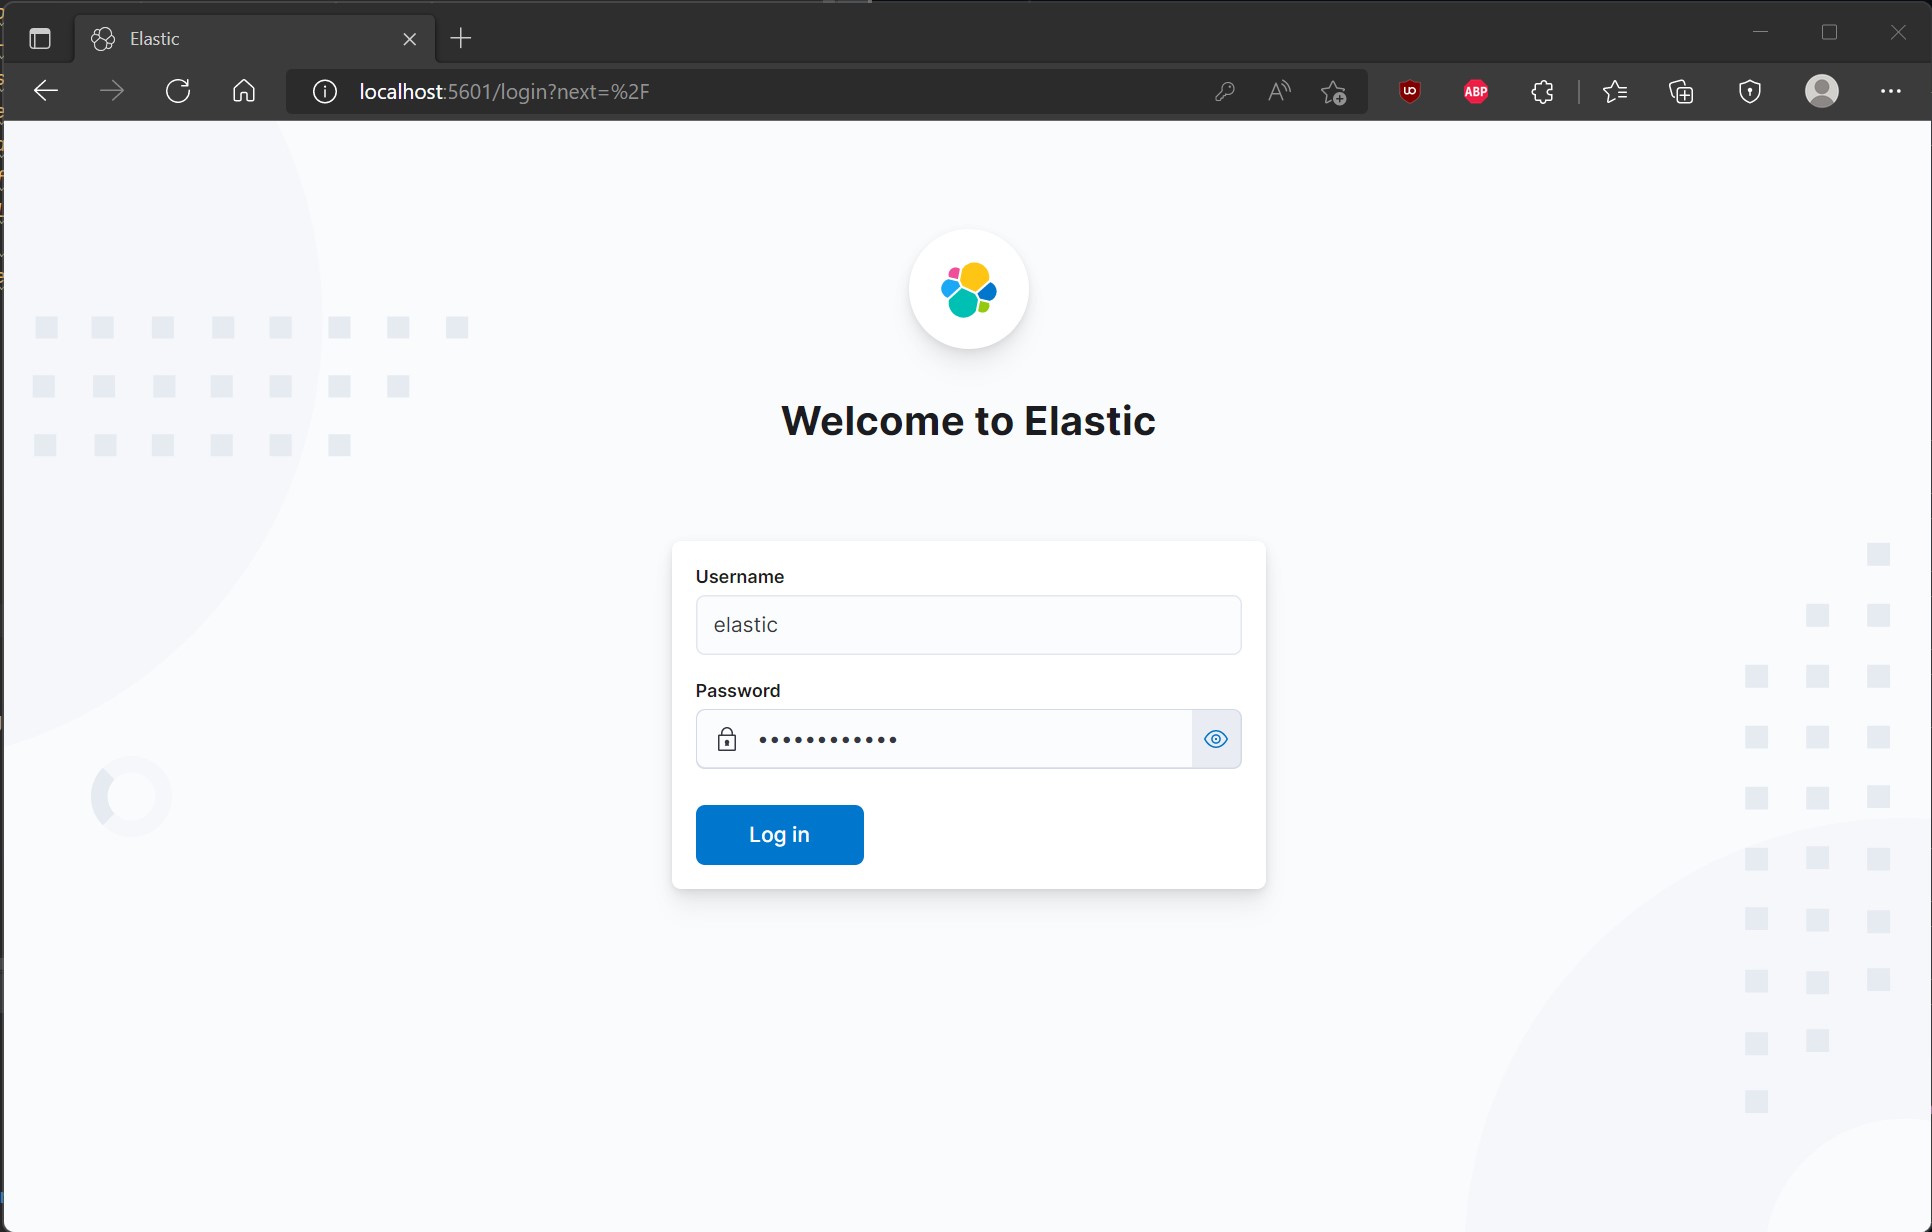
-
Go to the nav bar in the upper left-hand corner and click on the
Logssection underObservability.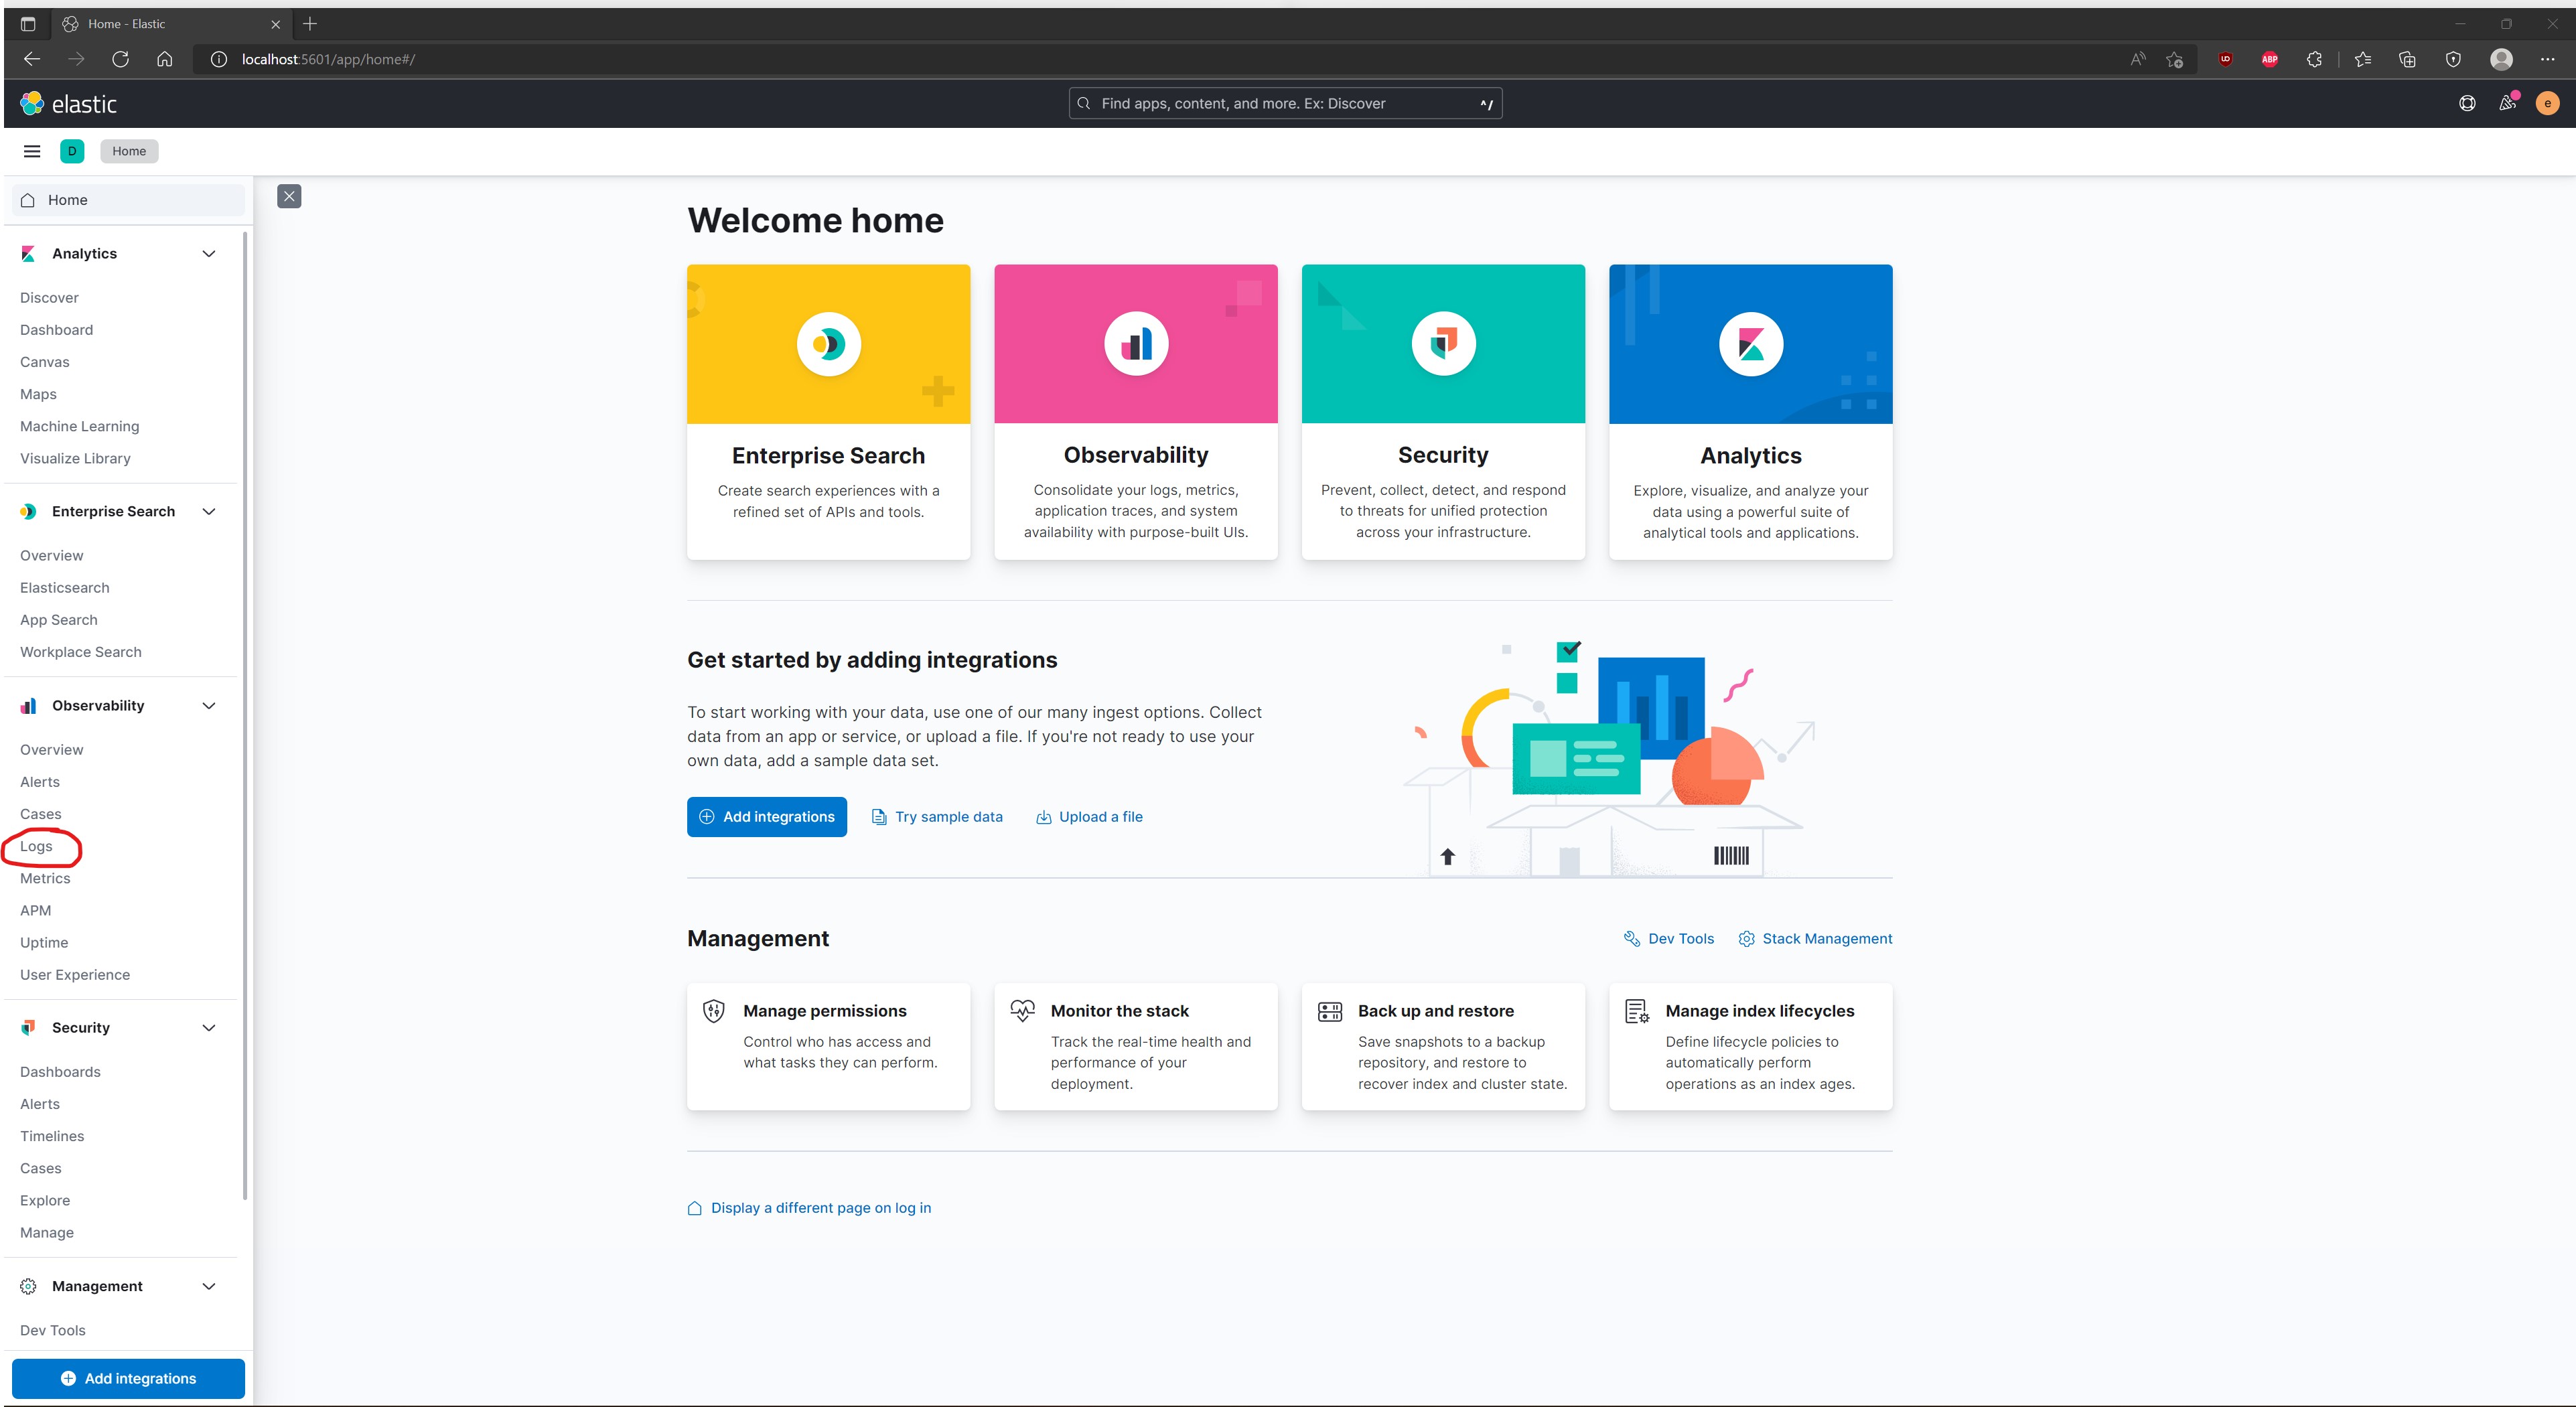
-
Click in the
Search for log entries...section and search the logs using the field of most interest. A first suggestion would be to typecontainer.name, then click on the field that pops up titledcontainer.name.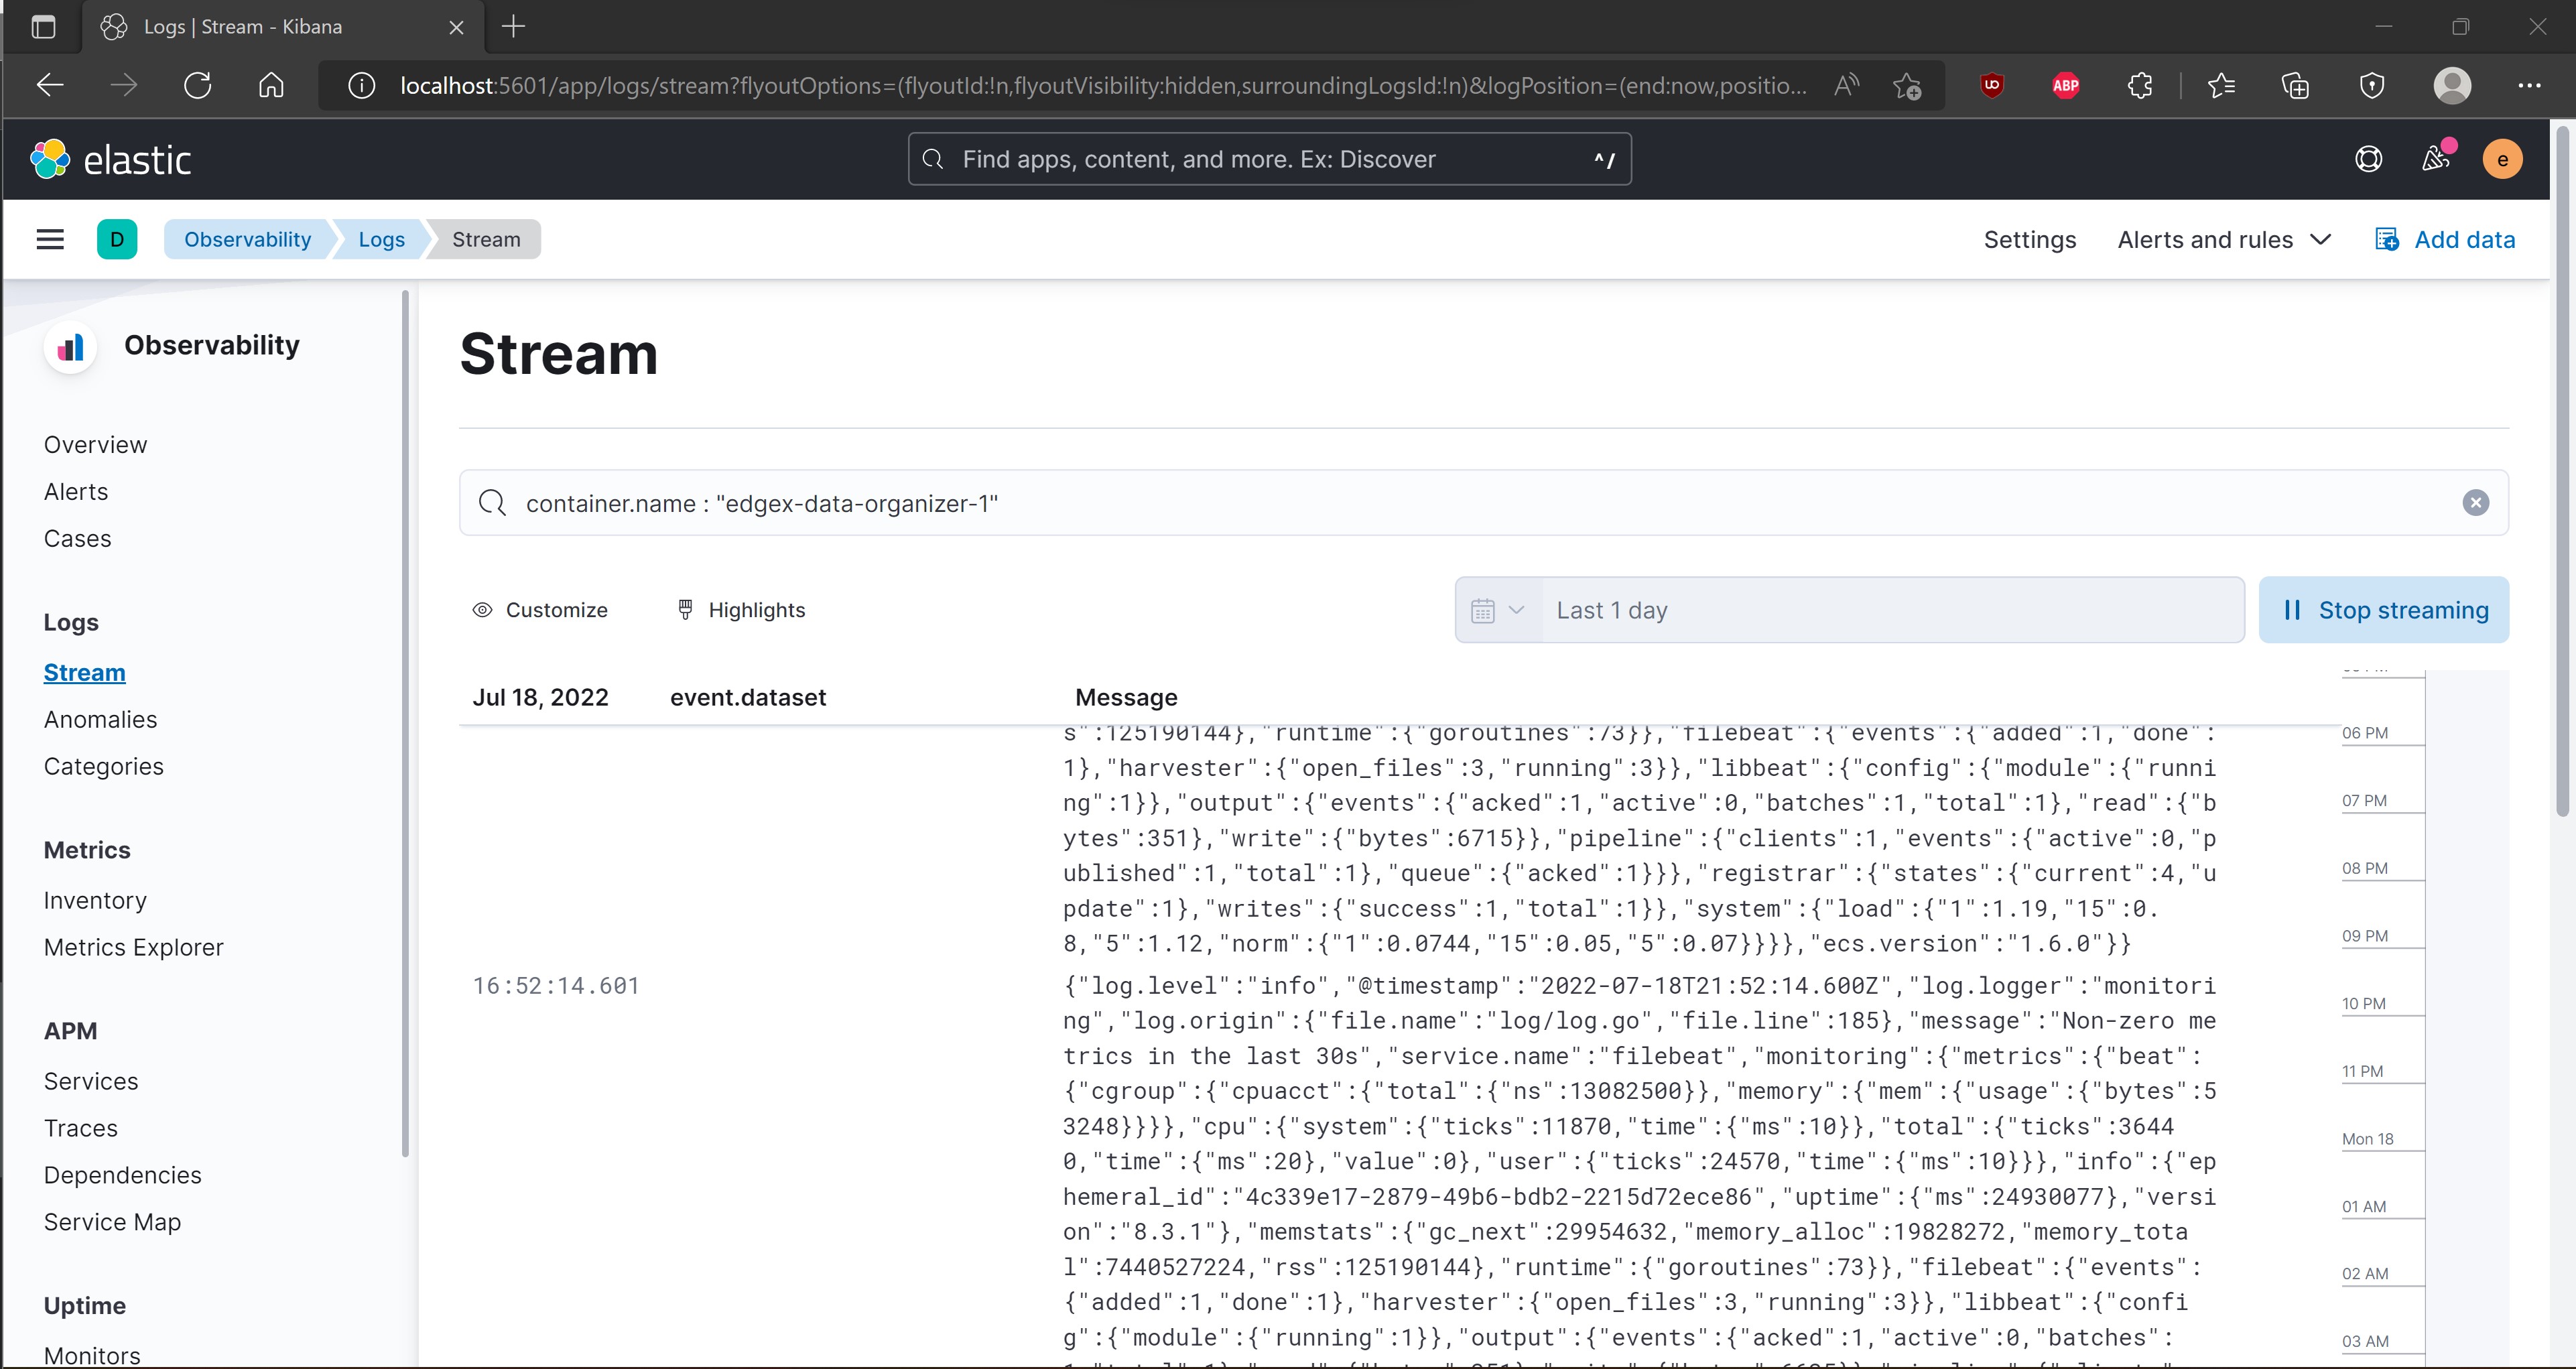
-
Type in the name of one of the services of interest and click
Live Stream.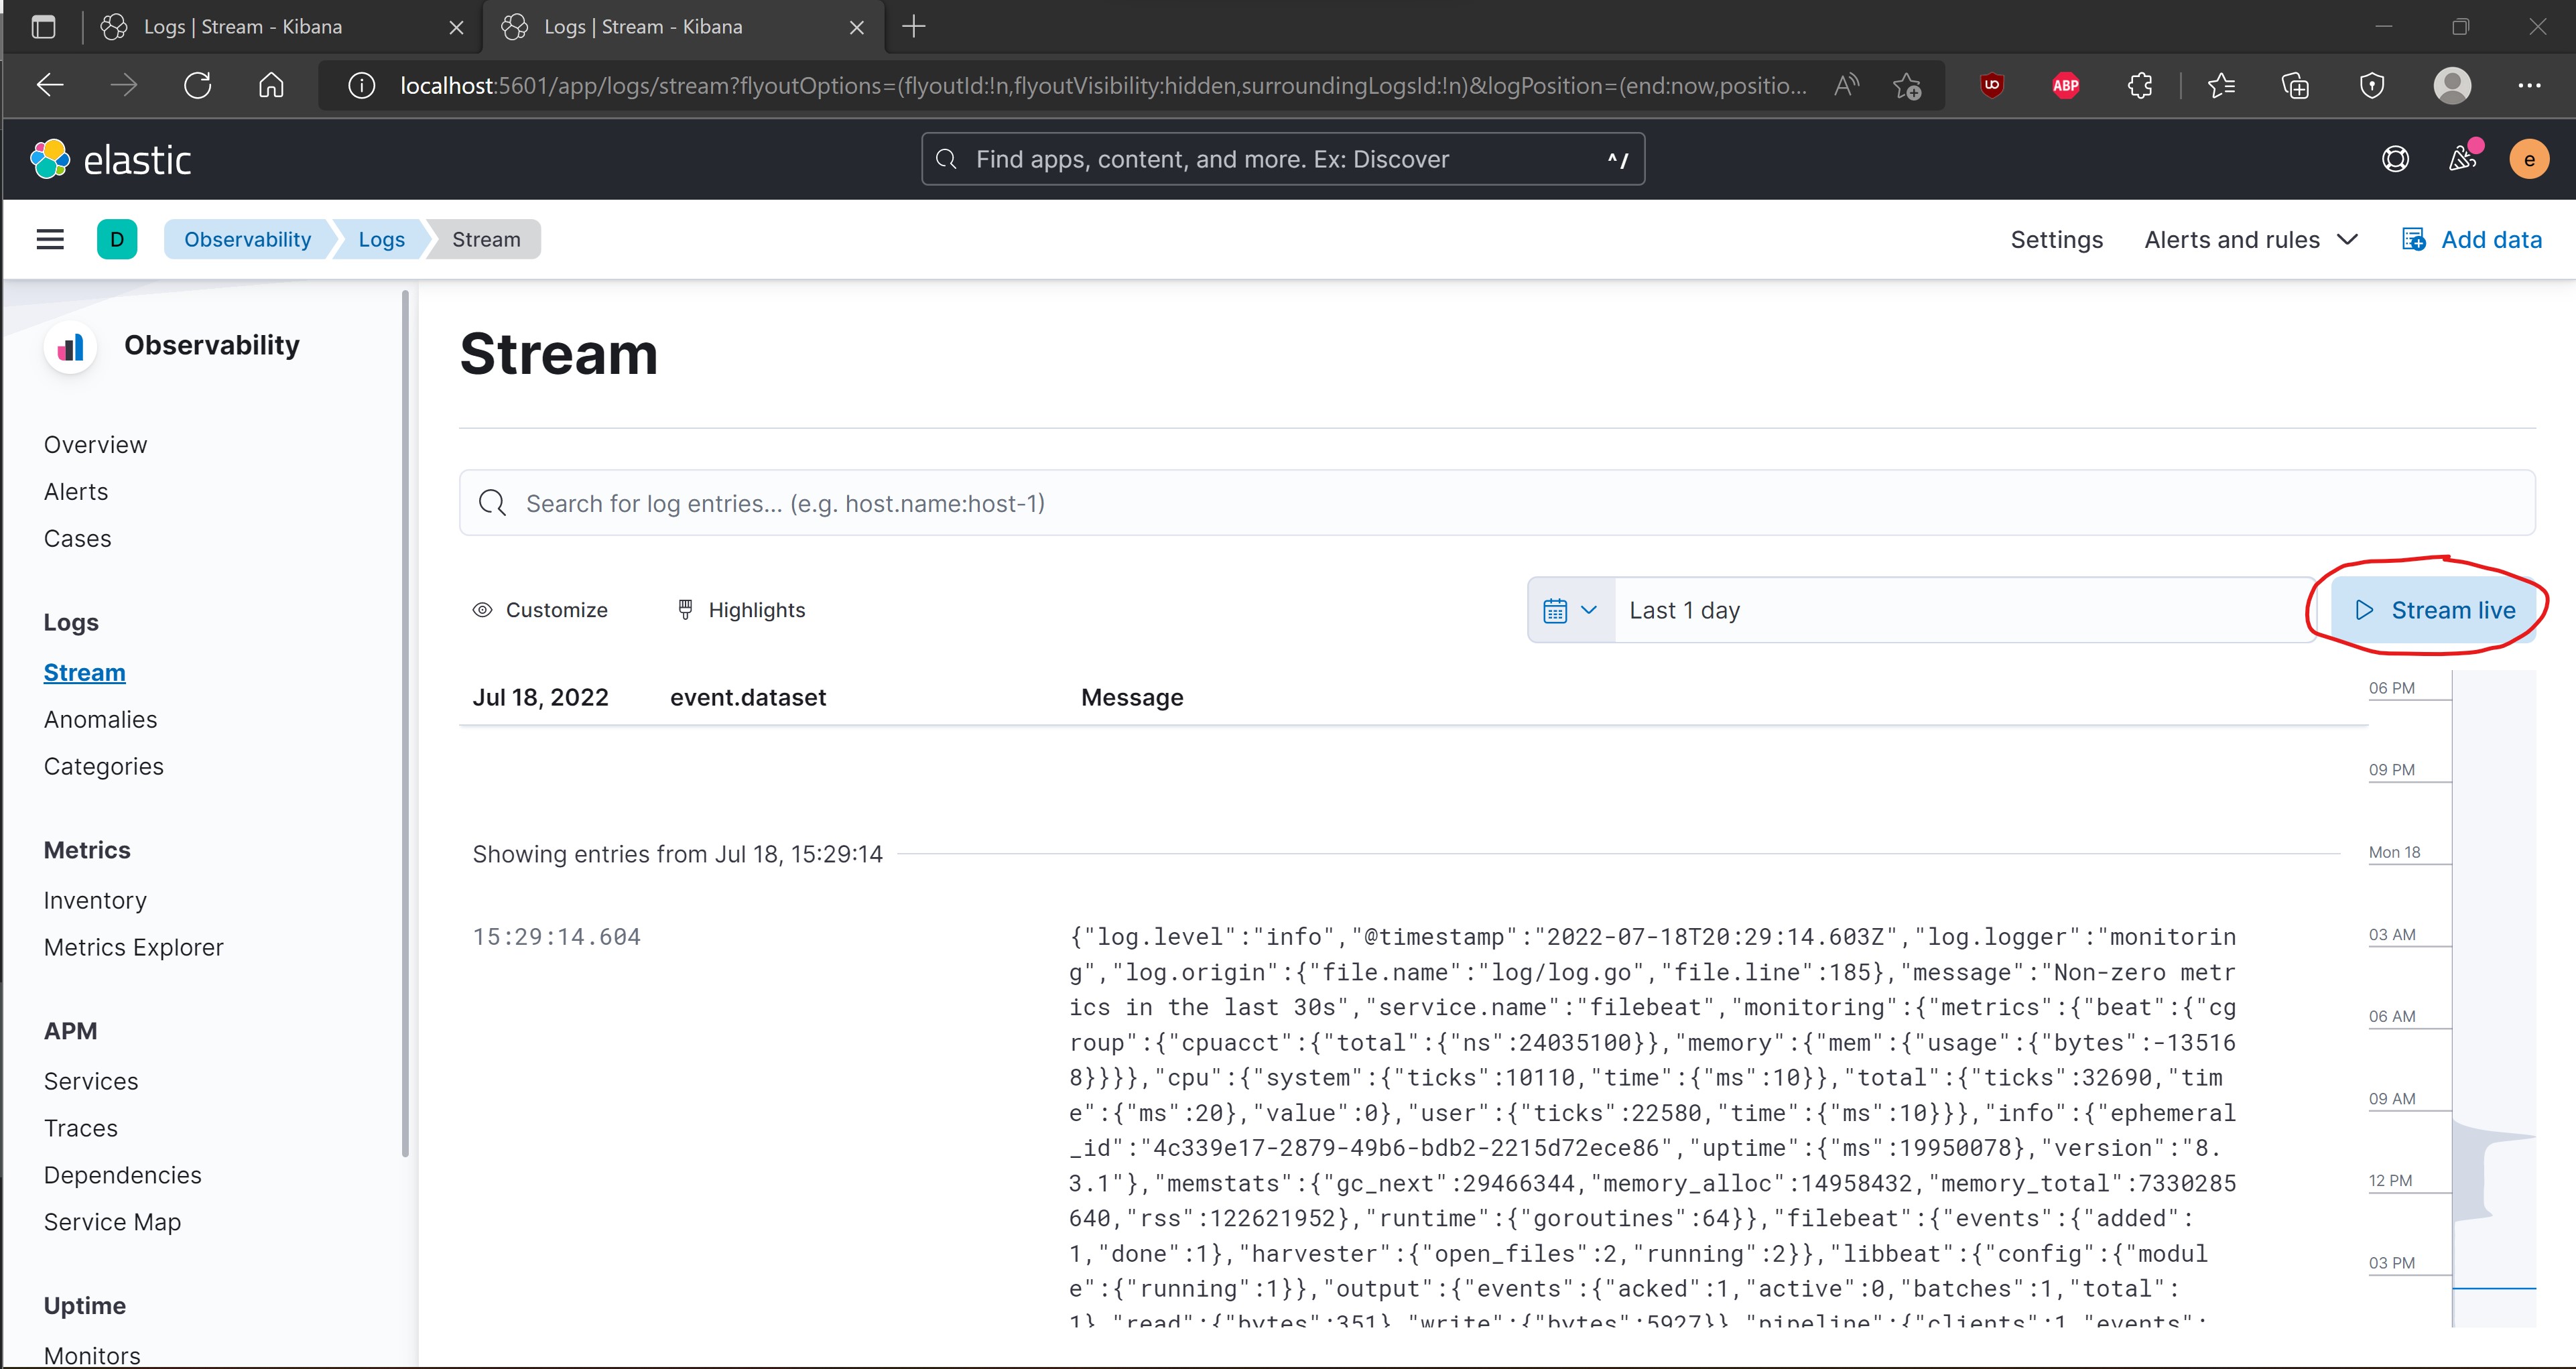
-
Verify logs are streaming in the entries section below.
BSD 3-Clause License: See License.