Telemetry
The telemetry feature is a tool to view the performance and utilization of an acceleration device. Telemetry data can be viewed on a per device and a per ring pair (also known as queue pair) basis.
Note
There are differences between the implementations of telemetry with the in-tree acceleration driver (QATlib) and the out-of-tree acceleration driver. Details for each are included in the sections below.
Important
Telemetry is supported across Intel QAT platforms, including QAT 2.x and QAT 5.1 (6xxx devices).
For QATlib (in-tree driver) deployments, refer to QAT Feature Compatibility and Version Requirements (Telemetry row) in the QATlib Release Notes for minimum kernel/firmware combinations per platform.
Telemetry Usage
Usage With Out-Of-Tree Driver
The telemetry feature is configured and queried using sysfs files in the Linux filesystem.
The telemetry sysfs folder is located at /sys/devices/pciAAAA:BB/AAAA:BB:CC.D/telemetry.
AAAA:BB:CC.Dis the Domain:BDF of the target Intel® QAT Endpoint.
Example:
sudo ls /sys/devices/pci0000\:6b/0000\:6b\:00.0/telemetry/
Note
Update the Domain:BDF above as needed.
Usage With In-Tree Driver (QATlib)
Important
Refer to QAT Feature Compatibility and Version Requirements in the QATlib Release Notes for kernel version requirements for enabling this feature.
The telemetry feature is configured and queried using debugfs files in the Linux filesystem.
The telemetry debugfs folder is located at /sys/kernel/debug/qat_*_*/telemetry.
qat_<device>_*is the Domain:BDF of the target Intel® QAT Endpoint.For 6xxx platforms, the device prefix is
qat_6xxx_*.
Example:
sudo ls /sys/kernel/debug/qat_4xxx_0000:6b:00.0/telemetry/
sudo ls /sys/kernel/debug/qat_6xxx_0000:6b:00.0/telemetry/
The telemetry debugfs interface uses the same file model across supported
platforms: device_data and rp_[A|B|C|D]_data. Ring pair telemetry
selection remains limited to four ring pairs at a time.
Note
Update the Domain:BDF above as needed.
The telemetry feature is controlled with standard linux file commands into the control file as outlined below.
The telemetry data is accessed through the device_data or rp_<X>_data file depending on what data is required.
The telemetry data for device level and ring pair level is updated each second.
Telemetry Control
Device level telemetry is enabled by echoing 1 into the control file and disabled by echoing 0.
Reading the control file will tell whether the feature is currently enabled or disabled.
Ring Pair level telemetry is enabled when device level telemetry is enabled. However the ring pairs need to be selected.
Only 4 ring pairs can be shown at any given time.
By echoing the number of the ring pair (0-63) into a rp_<X>_data file it can be selected. Where X is A,B,C or D.
Telemetry Commands
Operation |
Command |
|---|---|
Enable Telemetry |
|
Disable Telemetry |
|
Query Telemetry data |
|
Select Ring Pairs |
|
Query Ring Pair data |
|
Selecting Ring Pairs
Selecting Ring Paris Using Out-Of-Tree
This section provides guidance on the mapping of ring pairs to the VFs for the PF when using the Out-Of-Tree acceleration driver.
There are 4 Ring Pairs per VF. The Ring Pairs for a PF looks like the following:
VF |
Ring Pairs |
|||
|---|---|---|---|---|
1 |
0 |
1 |
2 |
3 |
2 |
4 |
5 |
6 |
7 |
3 |
8 |
9 |
10 |
11 |
4 |
12 |
13 |
14 |
15 |
5 |
16 |
17 |
18 |
19 |
6 |
20 |
21 |
22 |
23 |
7 |
24 |
25 |
26 |
27 |
8 |
28 |
29 |
30 |
31 |
9 |
32 |
33 |
34 |
35 |
10 |
36 |
37 |
38 |
39 |
11 |
40 |
41 |
42 |
43 |
12 |
44 |
45 |
46 |
47 |
13 |
48 |
49 |
50 |
51 |
14 |
52 |
53 |
54 |
55 |
15 |
56 |
57 |
58 |
59 |
16 |
60 |
61 |
62 |
63 |
The ServicesEnabled defined for the PF control the mapping of the Ring Pairs:
If only one workload is enabled (
dc/sym/asym), the first two columns are used for this service.If
dcandsymorasymis enabled, the first two columns are forsymorasymand the second two columns are fordcIf
symandasymis enabled, the first and third columns are forasymand second and fourth columns are forsym.
Device Level Telemetry Values
Value |
Meaning |
|---|---|
|
Message count, counter. |
|
PCIe Partial Transactions, counter. |
|
Max Read Latency, nanoseconds. |
|
Average Read Latency, nanoseconds. |
|
Max Get To Put latency, nanoseconds. |
|
Average Get To Put latency, nanoseconds. |
|
PCIe write bandwidth, Mbps. |
|
PCIe read bandwidth, Mbps. |
|
Average Page Request Latency, nanoseconds. |
|
Average Translation Latency, nanoseconds. |
|
Maximum uTLB Consumed, counter. |
|
Compression Slice Utilization On Slice X, percentage execution cycles. |
|
Decompression Slice Utilization On Slice X, percentage execution cycles. |
|
Translator Slice Utilization On Slice X, percentage execution cycles. |
|
Cipher Slice Utilization On Slice X, percentage execution cycles. |
|
Authentication Slice Utilization On Slice X, percentage execution cycles. |
|
UCS Slice Utilization On Slice X, percentage execution cycles. |
|
PKE Slice Utilization On Slice X, percentage execution cycles. |
Ring Pair Level Telemetry Values
Value |
Meaning |
|---|---|
|
Message count, counter. |
|
Number of the ring pair returning data. |
|
PCIe Partial Transactions, counter. |
|
Average Get To Put latency, nanoseconds. |
|
PCIe write bandwidth, Mbps. |
|
PCIe read bandwidth, Mbps. |
|
Descriptor DevTLB hit rate per ring, counter. |
|
Descriptor DevTLB miss rate per ring, counter. |
|
Payload DevTLB hit rate per ring, counter. |
|
Payload DevTLB miss rate per ring, counter. |
Monitoring Telemetry - Text Based
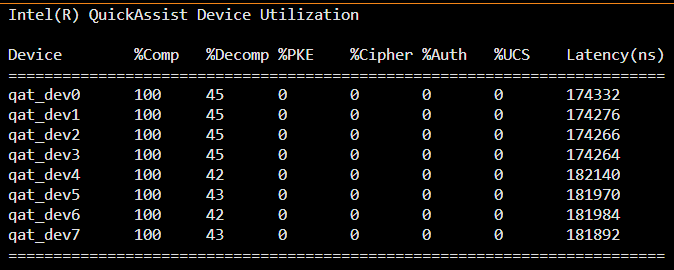
The following example Python scripts highlight how telemetry data can be monitored at the command line. The
script first enables telemetry service for each QAT endpoint that supports telemetry and is in the up
state. It then queries the telemetry data on a periodic basis collecting the data and formatting the display.
Monitoring Telemetry Using Out-Of-Tree
Device utilization script for Out-Of-Tree driver is included here.
Important
When running script as non-root User, ensure adf_ctl is added to qat group.
sudo chgrp qat /usr/local/bin/adf_ctl
Script can be downloaded from here
Running the script looks like:
sudo monitor-qat-oot-utilization
Monitoring Telemetry Using In-Tree
Device utilization script for In-Tree driver can be downloaded from here
Running the script looks like:
sudo monitor-qat-utilization
Monitoring Telemetry Demo
Here is a demonstration of how to monitor telemetry while running the Intel® QAT sample code.