Table of Contents
1 Principle of operation
Here is how wult works at a very high level.
- Schedule a delayed interrupt to happen at a future time LaunchTime.
- Let the CPU enter a C-state, where CPU stops executing instructions and saves power.
- At LaunchTime, the delayed interrupt fires and the CPU starts exiting the C-state. This process will take some time.
- When the CPU starts executing instructions, we take the time after idle timestamp (TAI).
- The C-state exit latency is TAI - LaunchTime.
This process is repeated tens or hundreds of thousands of times and the data are collected in a CSV file. Wult provides a capability for analyzing the CSV file (finding the median, percentiles, etc) as well as a capability for visualizing the test results (scatter plots, histograms).
1.2. Measured CPU
By default, wult measures C-state latency of CPU 0 (the first CPU you'll see in /proc/cpuinfo). The delayed interrupts are affinitized to the measured CPU. However, you can measure any other CPU as well - there is a command line option for this. But only one CPU is measured at a time.
1.3 Measurement methods
Today wult supports three measurement methods: hrt, tdt, and nic. All of these methods measure C-state latency, but they use different delayed interrupt sources.
- The hrt method uses Linux kernel High Resolution Timers (HRT) for scheduling delayed interrupts. HRT is a standard Linux kernel subsystem providing an API for arming a timer. On modern Intel hardware, HR timers are backed by TSC deadline timers CPU feature, which is part of CPU's LAPIC block. But the timers may also be backed by the "legacy" LAPIC timers as well. This is, however, opaque to wult's hrt method - it just uses the HRT API.
- The tdt method stands for "TSC deadline timers". This method uses the TSC deadline timer CPU feature for scheduling delayed interrupts. Unlike the hrt method, tdt directly uses some of the hardware registers in order to improve accuracy. However, the tdt method is more "hacky" comparing to the hrt method, and it has much less chances to ever be merged upstream. Please, use the hrt method, unless you have a specific reason to use tdt.
- The nic method stands for "Network Interface Card", and it uses a network card for as a delayed interrupts source. At this moment, only one type of NIC is supported: Intel I210. Since delayed interrupts are originated from a PCIe NIC, this method allows for measuring things like PCIe ASPM delay. However, this method requires an I210 NIC to be installed on the measured system.
Please, refer to this section for more information on how C-state measurement results depend on the delayed interrupt source.
1.4 Idle states with interrupts on and off
Most idle states are entered and exited with interrupts disabled. This means that Linux kernel's "cpuidle" subsystem disables idle CPU interrupts before requesting the C-state. On Intel CPUs, a C-state is requested using the mwait instruction, so it is executed with interrupts disabled.
When the CPU exits the C-state, it continues executing the next instruction after mwait. Even if the wake event was an interrupt, the CPU does not jump to it just yet. Instead, it runs small amount of "cpuidle" subsystem housekeeping code first. Then "cpuidle" enables local CPU interrupts (the sti instruction on Intel CPUs), and the CPU jumps to the interrupt handler.
For this type of idle state, wult measures both wake latency (WakeLatency) and interrupt latency (IntrLatency). Wake latency is sampled shortly after mwait, while interrupt latency is sampled in the interrupt handler.
Some idle states are entered with interrupts enabled, such as the 'POLL' state, which wult can measure too. Another example would be the C1 C-state on Icelake Xeon platform when the intel_idle driver is used. In these cases when the CPU exists the idle state, it jumps to the interrupt handler right away.
For this type of idle state, wult measures only interrupt latency (IntrLatency).
1.5 Measurement steps
This section will walk you through the main wult measurement cycle steps. The goal is to demonstrate the principle of operation, so many details will be omitted.
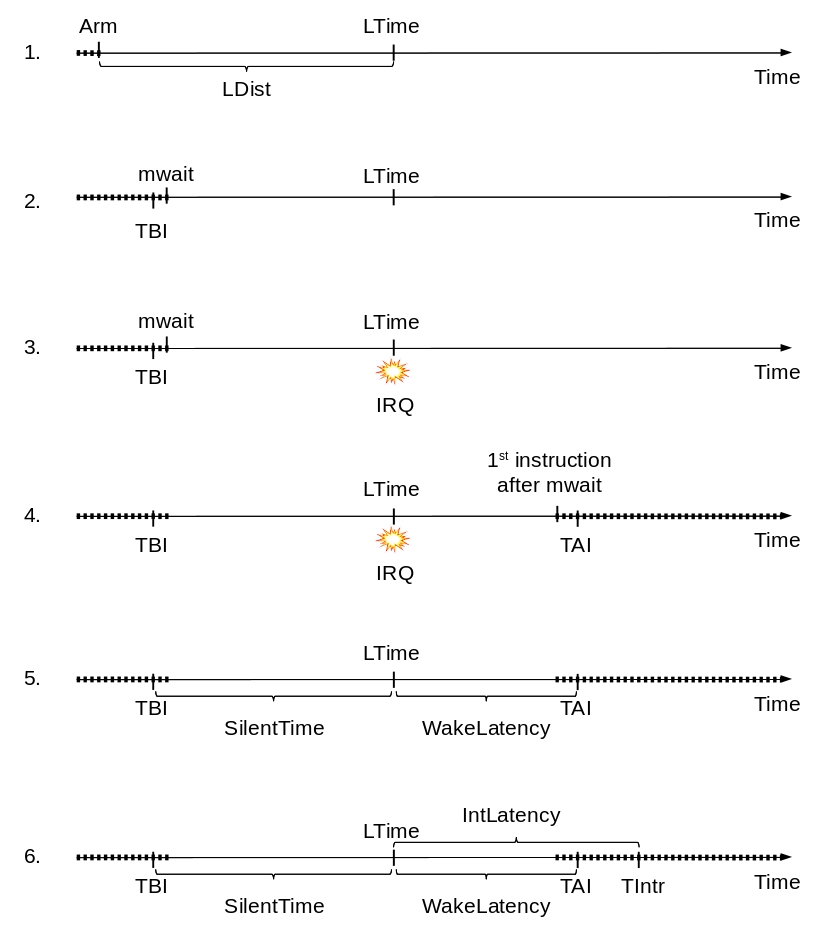
Here are the steps for measuring wake latency of a C-state entered with interrupts disabled.

Step 1: arm delayed event
Wult kernel driver arms a delayed event. In case of an hrt or tdt methods, this will be a timer event. In case of the nic method, this will be a NIC event.
The delayed event is armed LDist milliseconds ahead. Driver selects a random LDist value in a user-configurable range (0-4 milliseconds by default).
The delayed event is armed to happen at time "LaunchTime", also referred to as LTime.
Step 2: enter idle state
Once the delayed interrupt is armed, wult driver just does nothing and waits for it to happen. Since wult is supposed to be used on an idle system, the measured CPU most probably start entering an idle state, because there are supposedly no tasks to run.
The CPU runs Linux idle task, which eventually disables local interrupts (the cli instruction on Intel CPUs) and requests a C-state by executing the mwait instruction.
Before Linux requests a C-state, wult driver takes the "Time Before Idle" time-stamp, also referred to as TBI. In case of the tdt and hrt methods, this is the TSC counter value (the rdtsc instruction on Intel CPUs). In case of the nic method, this is the NIC's own, independent time stamp counter value.
Once the mwait instruction is executed, CPU enters a C-state and does not execute more instructions. Instead, the CPU waits for an event and saves power.
Note, if CPU never enters an idle state during the LTime period of time, the delayed interrupt fires while the CPU is not idle (C0 state). In this case the result of experiment is discarded and wult driver repeats Step 1.
Step 3: delayed event
When the delayed event happens, the CPU starts exiting the C-state. This takes some time. Deeper C-states (e.g., C6 on Intel CPUs) result in longer exit latency than shallower C-states, such as C1.
Step 4: resume execution
Eventually the CPU resumes instructions execution starting from the first instruction after mwait. Even though there is a pending interrupt, the CPU does not handle it yet, because interrupts are disabled.
Step 5: wake latency
Shortly after the CPU wakes up, wult driver takes the "Time After Idle" time-stamp, also referred to as "TAI".
TAI, TBI, and LTime are used for calculating WakeLatency and SilentTime:
- WakeLatency = TAI - LTime
- SilentTime = LTime - TBI
WakeLatency is the time between the delayed event and CPU execution resume, modulo the TAI overhead (it takes time to get TAI, and there are other instructions between the first executed instruction and the TAI read). In other words, this is an approximation of C-state exit latency.
SilentTime is the time between mwait and the delayed event, modulo the TBI overhead (it takes time to get TBI, and there are other instructions between TBI read and mwait). In other words, this is approximate time the CPU stayed idle.
Step 6: interrupt latency
The CPU continues executing the Linux "cpuidle" subsystem code, doing a bit of housekeeping (e.g., take some C-states statistics). Then the interrupts get enabled (the sti instruction on Intel CPUs), and the CPU jumps to the interrupt handler.
In the interrupt handler wult will take the "Time in Interrupt" time-stamp, also known as "TIntr". This time-stamp is used for calculating Interrupt Latency, also known as "IntrLatency".
- IntrLatency = TIntr - LTime
IntrLatency is the time between the delayed event and the moment CPU reaches delayed event's interrupt handler, modulo the Linux "cpuidle" subsystem and generic interrupt handling subsystem overhead. In other words, this is an approximation of interrupt latency.
2 Interrupt source
Measuring C-state wake latency is based on delayed interrupts, and today wult supports two delayed interrupt sources: TSC deadline timer/LAPIC timer (hrt and tdt methods) and Intel I210 PCIe NIC (nic method).
2.1 Timer
In case of the hrt and tdt wult measurement methods, the delayed events are scheduled by simply arming a local CPU timer.
All modern Intel CPUs support the TSC deadline timer feature, which is provided by the LAPIC block. This feature allows for scheduling an interrupt in TSC cycles: the OS basically programs the TSC counter value for the CPU to generate an interrupt at. TSC (Time Stamp Counter) increments every CPU cycle, so this is a very high-resolution timer.
On older Intel CPUs, the LAPIC block does not support TSC deadline timers, in which case Linux kernel uses coarser "LAPIC timers". Linux kernel may fall-back to using LAPIC timers if it detects that TSC is unstable or if Linux TSC deadline timers support was disabled by the user.
This hrt wult method should work with both TSC deadline and legacy LAPIC timers. The tdt wult method works only with TSC deadline timers.

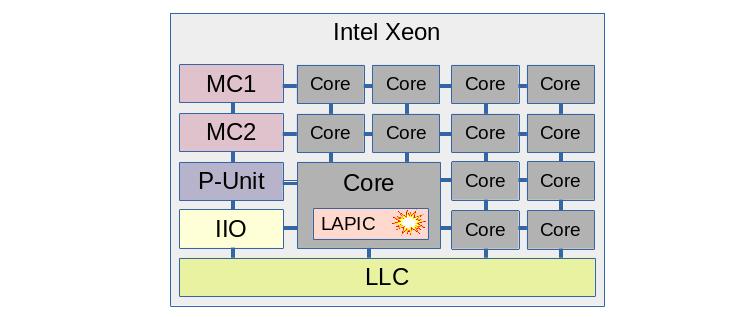
The picture illustrates a timer interrupt on an Intel Xeon chip. The chip contains many cores, but only one core is being measured (if hyper-threading is enabled, one hyper-thread is measured). This core has the LAPIC block, and this block generates the interrupts which wult's hrt and tdt methods use for measuring C-state latency.
Just for reference: MC stands for "Memory Controller", LLC stands for Last Level Cache (shared between the cores). P-unit is a microcontroller responsible for power and performance features like C-states, P-states, etc.
2.2 NIC
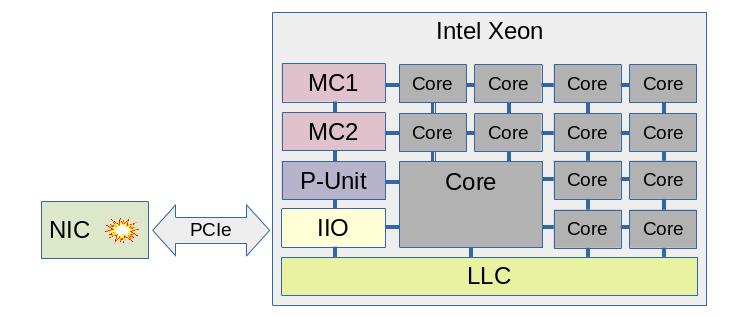
In case of the nic wult method, the delayed interrupt source is the Intel I210 PCIe network card (NIC).

Notice that the interrupt source is much further from the measured core in this case. The interrupt signal has to travel via PCIe link(s) and bridge(s) into the IIO block, and then it gets routed to the measured CPU.
Today, only the Intel I210 NIC is supported, but more NIC types may be supported in the future. This NIC has a built-in crystal oscillator and provides an independent clock, which can be read by the CPU. The CPU can program the NIC to generate an interrupt when NIC's clock counter reaches certain value.
2.3 Timer vs Nic
Both hrt/tdt and nic methods measure CPU C-state latency, and they may produce similar or different results depending various factors. Let's look at some of them.
2.3.1 PCIe ASPM
PCIe ASPM (Active State Power Management) is a PCIe power management feature, described in PCIe specifications and supported by many Intel chips. This feature is about PCI links power management - when a link is not used, it can be sent into a low power state such as L1. In this state the link cannot be used, so when there are data to transfer, the link transitions to the L0 state. This transition requires link re-training and takes time.
PCIe ASPM is typically transparent to Linux - the hardware and firmware manages link states automatically. However, Linux can enable and disable ASPM for PCIe devices.
Enabling PCIe ASPM for the I210 NIC will increase the measured C-state latency when using the nic method, and won't affect the measured C-state latency when using hrt/tdt methods.
Here is a diff for an Intel Xeon E5-2697 v2 system. It compares C-state latency for PCIe ASPM enabled and disabled configurations. The deepest C-state was C6. The median wake latency is 82.6us (ASPM on) and 73.8us (ASPM off), which means that PCIe ASPM adds about 8.8 microseconds to the median.
Here is a small decoder for the "ivt-nic-c6-hfm-noaspm" name:
- ivt - comes from IvyTown, name of the server platform that we tested.
- nic - the result was produced using the nic method.
- c6 - the deepest C-state Linux was allowed to request when we ran wult was "C6".
- hfm - comes from "High Frequency Mode", same as base frequency. This means that in this test we locked CPU frequency to HFM, so CPU frequency transitions were disabled.
- noaspm - PCIe ASPM was disabled.
2.3.1.1 A word of warning
The Intel I210 network card is a relatively old design - it is a PCIe Gen 2 card, while modern Intel CPUs are PCIe Gen 4 and Gen 5. Therefore, this network card may not be a perfect device for measuring PCI-related delays. We did not have time to support a more modern NIC, but this should generally be possible.
2.3.2 C-state pre-wake
Some Intel CPUs have able to pre-wake the CPU from a C-state if there is a timer firing soon. The P-unit on such systems is timer-aware and optimizes some of the C-states. Not every Intel chip, however, has this feature.
Interrupts from a NIC can not be predicted by the P-unit and therefore, the C-state pre-wake feature cannot reduce the measured C-state latency.
Here is an example test result for an Intel Xeon E5-2697 v2 system. It is actually a diff comparing C-state latency for the nic and tdt measurement methods. The deepest C-state was C6. Notice that the median wake latency is 73.8us (nic) and 17.6us (timer). The timer method shows about 76% latency reduction.
Note, you can disable the pre-wake feature and measure the "unoptimized" C-state latency even with the hrt or tdt methods (e.g., verified on IceLake Xeon). You can do this using the "--cstate-prewake" option of the pepc tool.
2.3.3 PCI topology
When using the nic measurement method, the location of the NIC in the PCIe matters. E.g., consider a 2-socket server system with the following PCIe slots.
- Slot A is connected directly to the IIO block (part of the "north complex") of socket 0.
- Slot B is connected directly to the IIO block of socket 1.
- Slot C is connected to PCH, which is connected to socket 0.
Suppose we are measuring C-state latency of CPU0, which is on core 0 of socket 0. In this case Slot A provides the shortest and fastest path. Slot B provides longer and slower path, because interrupts (typically MSI messages) will be delivered to socket 1, and then to socket 0. And slot C provides provides a longer path as well.