Examples
The examples below demonstrate some of the capabilities of the P3 Analysis Library.
Click on a thumbnail to view the code that produced it.
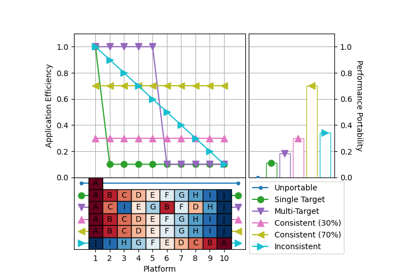
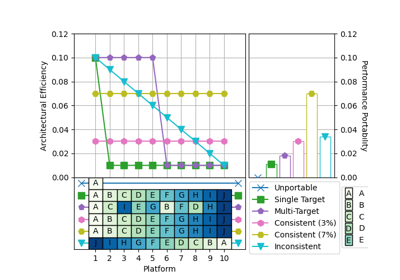
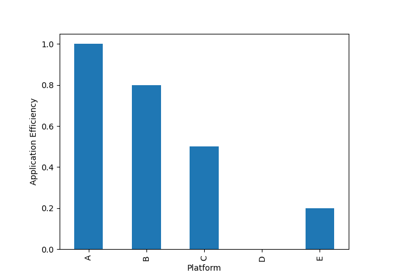
Cascade Plots
Cascade plots summarize the efficiency and performance portability of each application, highlighting differences in platform support.
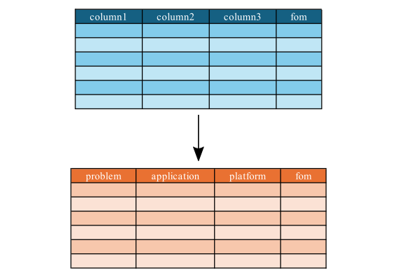
Metrics
Generating metrics from raw P3 data is a pre-requisite for generating specific plots. Understanding how to manipulate and prepare raw P3 data enables the exploration of more complex “what if” scenarios and more detailed analyses.
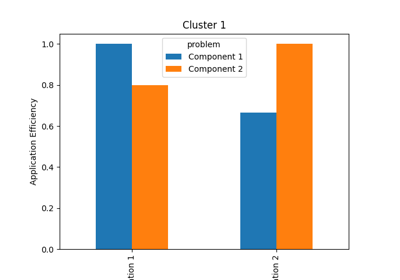
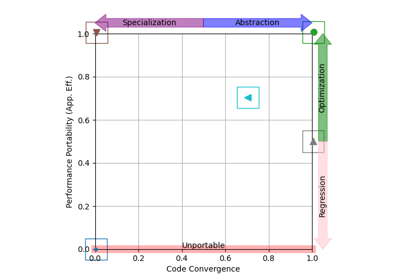
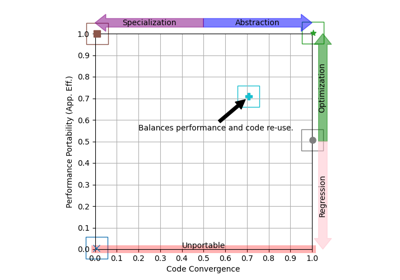
Navigation Charts
Navigation charts show the performance portability and code convergence of each application, highlighting the tradeoff between performance (portability) and programmer productivity.