Implementation Considerations
When integrating Intel® QAT into your application stack, consider the following:
Platform Compatibility: Ensure that your hardware platform supports Intel® QAT.
Software Integration: Follow the performance optimization guide provided by Intel to seamlessly integrate Intel® QAT software with your application.
Workload Profiling: Identify workloads that benefit most from hardware acceleration. Not all tasks require Intel® QAT, so choose wisely.
Platform Compatibility
To check that your hardware platform supports Intel® QAT, perform the following command:
lspci -nn | egrep -e '8086:37c8|8086:19e2|8086:0435|8086:6f54|8086:4940|8086:4942|8086:4944|8086:4946'
The output from a high-end 4th Gen Intel® Xeon® Scalable Processor is similar to the following:
6b:00.0 Co-processor [0b40]: Intel Corporation Device [8086:4940] (rev 40)
70:00.0 Co-processor [0b40]: Intel Corporation Device [8086:4940] (rev 40)
75:00.0 Co-processor [0b40]: Intel Corporation Device [8086:4940] (rev 40)
7a:00.0 Co-processor [0b40]: Intel Corporation Device [8086:4940] (rev 40)
e8:00.0 Co-processor [0b40]: Intel Corporation Device [8086:4940] (rev 40)
ed:00.0 Co-processor [0b40]: Intel Corporation Device [8086:4940] (rev 40)
f2:00.0 Co-processor [0b40]: Intel Corporation Device [8086:4940] (rev 40)
f7:00.0 Co-processor [0b40]: Intel Corporation Device [8086:4940] (rev 40)
Software Integration
Intel® QAT can be accessed through various software frameworks, enabling acceleration for specific workloads. Let’s explore some of these frameworks:
Compression Applications
Here is the software stack for compression based applications.
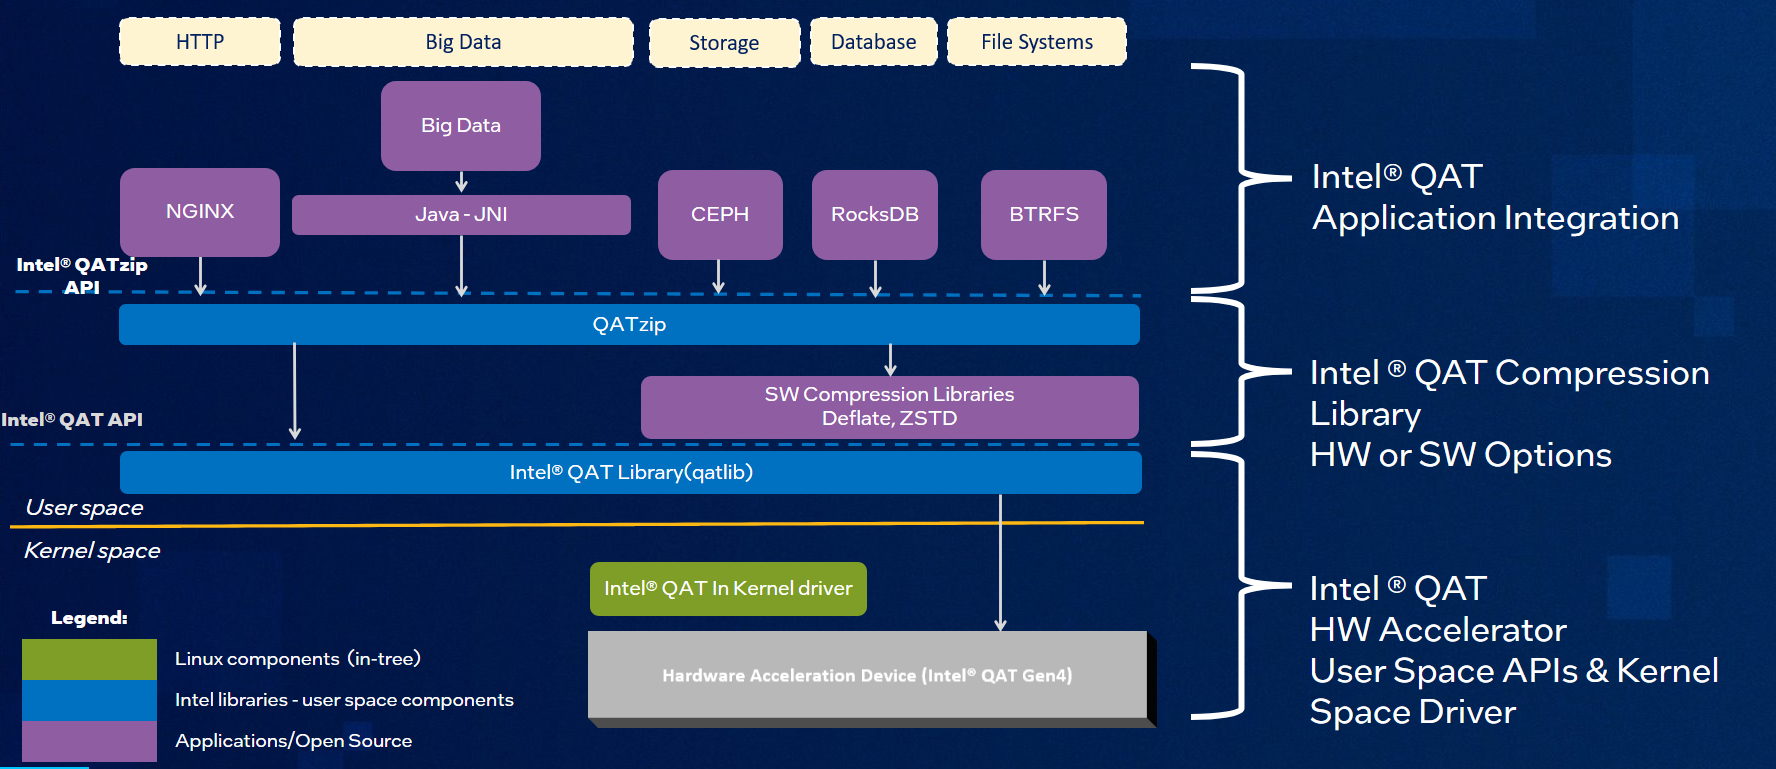
From this stack we see that applications can utilize QAT by:
Coding directly to the Intel QuickAssist Compression APIs
Application developers can directly access QAT features through the Intel® QuickAssist API. This API provides an easy interface between customer applications and the QuickAssist acceleration driver. It allows seamless integration of Intel® QAT capabilities into custom software.
Useful links:
Code to QATzip APIs
Application developers can directly access compression capabilities by programming to QATzip APIs. This API provides an easy interface between customer applications and the QuickAssist acceleration driver. It allows seamless integration of QAT capabilities into custom software. QATzip APIs also provide the benefit of software fallback which allows your application to work on systems with and without QAT.
Useful links:
Use Data Compression Applications that have been updated for Intel® QAT
A number of applications/libraries have already been updated to take advantage of Intel® QAT. These include:
RocksDB => https://github.com/intel/qat-plugin-rocksdb
qat-java => https://github.com/intel/qat-java
Crypto Applications
Here is the software stack for encryption based applications.
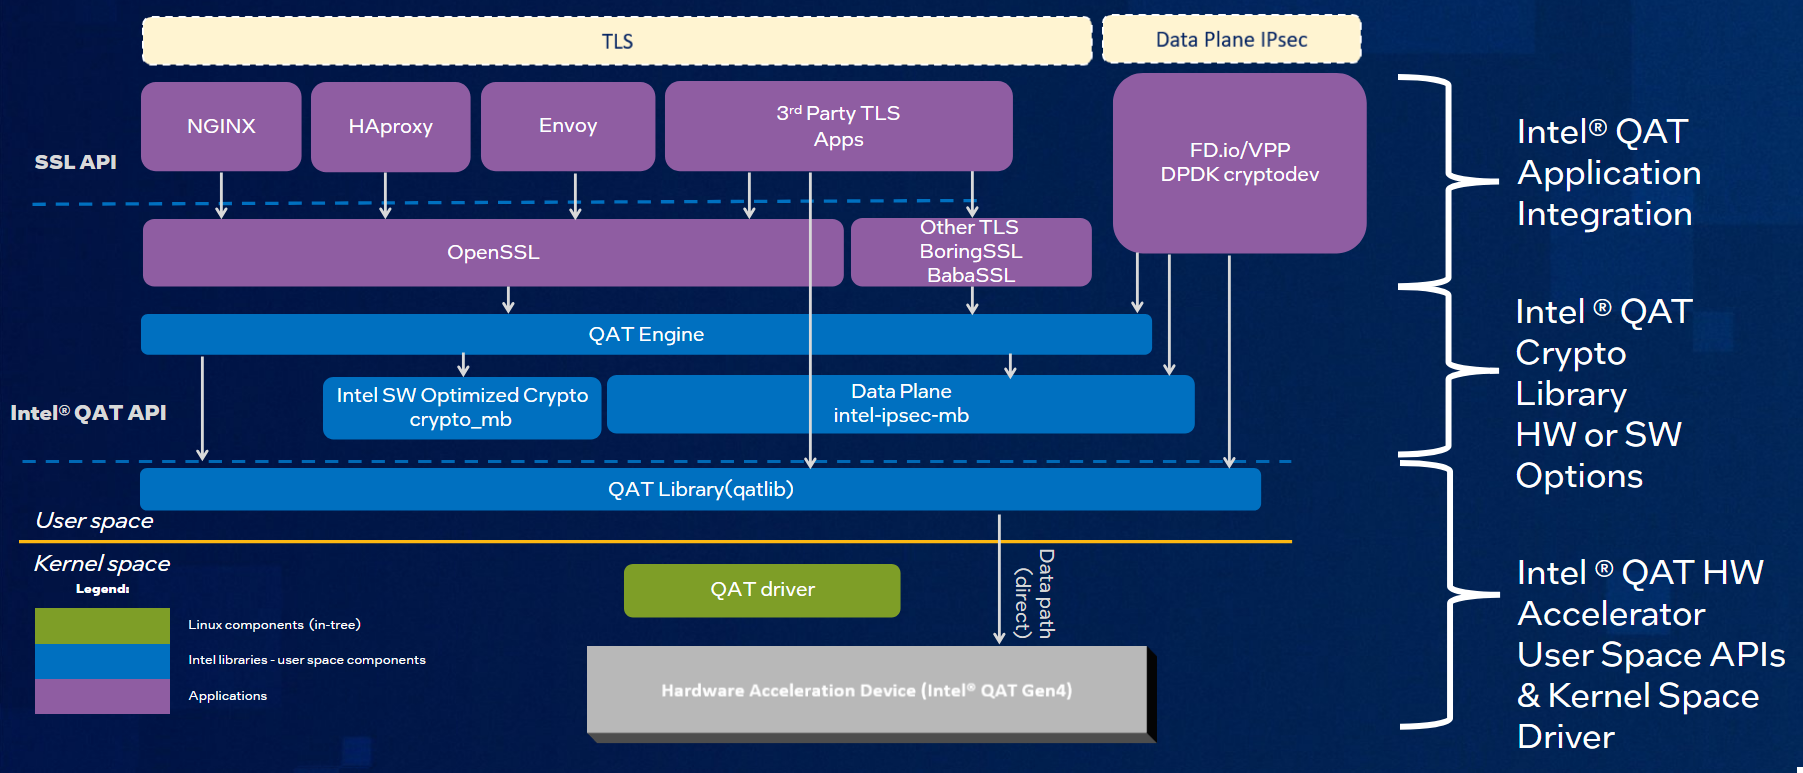
From this stack we see that applications can utilize Intel® QAT by:
Coding directly to the Intel QuickAssist Cryptographic APIs
Application developers can directly access Intel® QAT features through the Intel® QuickAssist API. This API provides an easy interface between customer applications and the QuickAssist acceleration driver. It allows seamless integration of Intel® QAT capabilities into custom software.
Useful links:
OpenSSL Applications
Many applications utilize OpenSSL for their crypto need. Examples of applications include NGINX, HAProxy, and ssh. QAT_Engine was designed to fit into OpenSSL’s modular framework and allows applications to offload their crypto needs to Intel® QAT hardware as well as to optimized software libraries that take advantage off CPU instructions. For performance reasons, ensure the application is able to interact with OpenSSL using async.
Useful links:
Use Crypto Applications that have been updated for Intel® QAT
A number of applications/libraries have already been updated to take advantage of Intel® QAT. These include:
Workload Profiling
To help answer the question on whether Intel® QAT can bring value to your application we need to identify hotspots in the application. Application profiling can be used for this purpose.
perf top
perf top is a powerful tool for real-time system profiling, allowing you to analyze CPU usage at the function level. Unlike traditional tools like top, which focus on processes or threads,
perf top provides insights into how much CPU time specific functions consume.
Let’s dive into how to use it effectively.
Prerequisites
Before using perf top, ensure you have the following:
Installed perf
To install perf on Debian based distros:
sudo apt update
sudo apt install linux-tools-common
To install perf on RPM based distros:
sudo dnf update
sudo dnf install perf
Running perf top
Open a terminal with root access.
Start the
perf topmonitoring interface:The monitoring interface will display information similar to the following:
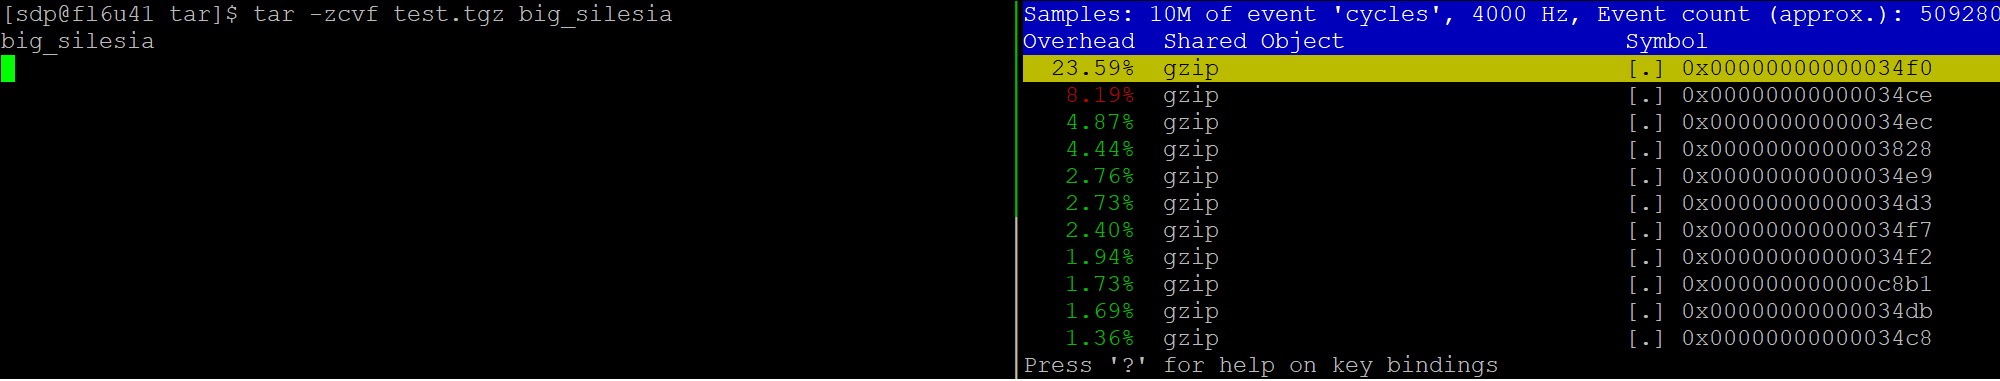
Interpreting the Output
The perf top interface provides several columns:
Overhead: Displays the percentage of CPU time used by each function.
Shared Object: Shows the program or library associated with the function.
Symbol: Displays the function name or symbol.
In the example above, there is significant time spent in the gzip library. Given the benefit that Intel® QAT brings to compression, this application is a prime candidate to benefit from Intel® QAT.
Flamegraphs
Flame graphs are powerful visualizations for analyzing application performance, particularly when profiling CPU usage. They allow you to identify hotspots and bottlenecks in your code.
These graphs utilize the profile data captured from perf top.