Kineto Supported Profiler Tool (Prototype)
Introduction
The Kineto supported profiler tool is an extension of PyTorch* profiler for profiling operators’ executing time cost on GPU devices. With this tool, you can get information in many fields of the run models or code scripts. Build Intel® Extension for PyTorch* with Kineto support as default and enable this tool using the with statement before the code segment.
Use Case
To use the Kineto supported profiler tool, you need to build Intel® Extension for PyTorch* from source or install it via prebuilt wheel. You also have various methods to disable this tool.
Build Tool
The build flag USE_PTI is default ON for Intel® Extension for PyTorch* to enable the PTI-based Kineto Profiler. Before building, you need to make sure the PTI-SDK is well preinstalled and sourced in your env.
Here is the command you can use to download the PTI-SDK onto your machine: wget https://registrationcenter-download.intel.com/akdlm/IRC_NAS/5987ec30-be32-4dee-870f-7b97a1113488/l_intel-pti-dev_p_0.9.0.33_offline.sh. After downloading the file, you need to install it by running sh l_intel-pti-dev_p_0.9.0.33_offline.sh. After you install the PTI, you need to run source <path-of-installation>/pti/latest/env/vars.sh to source the PTI, then you can start your building.
Use Tool
Add Profiler Into Script
All the usages are aligned with the official PyTorch* suggested. Please refer to PyTorch*’s tutorial page for the first step.
In your model script, write with statement to enable the Kineto supported profiler tool ahead of your code snippets, as shown in the following example:
# import all necessary libraries
import torch
from torch.profiler import profile, ProfilerActivity
import intel_extension_for_pytorch

# these lines won't be profiled before enabling profiler tool
input_tensor = torch.randn(1024, dtype=torch.float32, device='xpu:0')

# enable Kineto supported profiler tool with a `with` statement
with profile(activities=[ProfilerActivity.CPU,
                         ProfilerActivity.XPU]) as prof:
    # do what you want to profile here after the `with` statement with proper indent
    output_tensor_1 = torch.nonzero(input_tensor)
    output_tensor_2 = torch.unique(input_tensor)

# print the result table formatted by the profiler tool as your wish
print(prof.key_averages().table())
In your model script, you can also assign a schedule for profile loops of iterations, as shown in the following example:
from torch.profiler import schedule

# assign a customized schedule
my_schedule = schedule(
    skip_first=10,
    wait=1,
    warmup=3,
    active=1,
    repeat=2)

# also define a handler for outputing results
def trace_handler(p):
    print(p.key_averages().table(sort_by="self_xpu_time_total", row_limit=10)
    p.export("/tmp/trace_" + str(p.step_num) + ".json")

# pass customized schedule and trace handler to profiler outside the for-loop
with profile(activities=[ProfilerActivity.CPU,
                         ProfilerActivity.XPU],
             schedule=my_schedule,
             on_trace_ready=trace_handler) as prof:
    for iter in range(len(dataloader)):
        model(input)
        # don't forget a step() at the end of each loop
        prof.step()
There are a number of useful parameters defined in torch.profiler.profile. Many of them are aligned with usages defined in PyTorch*’s official profiler, such as record_shapes, a very useful parameter to control whether to record the shape of input tensors for each operator. To enable Kineto supported profiler on XPU backend, remember to add torch.profiler.ProfilerActivity.XPU into the list of activities. For the usage of more parameters, please refer to PyTorch*’s API reference.
Disable Tool in Model Script
To disable this profiler tool in your model script, you must remove those profiler related code as PyTorch* doesn’t offer a switch in torch.profiler.profile API. To reduce effort to switch the profiler on and off, it is suggested to use contextlib for control like below:
import contextlib

def profiler_setup(profiling=False, *args, **kwargs):
    if profiling:
        return torch.profiler.profile(*args, **kwargs)
    else:
        return contextlib.nullcontext()

# you can pass official arguments as normal
with profiler_setup(profiling=should_profile,
                    activities=[ProfileActivity.XPU],
                    schedule=my_schedule,
                    on_trace_ready=trace_handler) as prof:
    for iter in range((len(dataloader)):
        model(input)

        if should_profile:
            prof.step()
Profile on Multi-device Application
Follow typical usages for profiling multi-device application. Explicitly call torch.xpu.synchronize(device_id) for all involved devices. Such as:
# Run this example, please make sure you have more than one device.
assert torch.xpu.device_count() > 1, "This example need more than one device existed."

# put first input on device "xpu:0"
a_0 = torch.randn(100).to(torch.device("xpu:0"))
# put second input on device "xpu:1"
a_1 = torch.randn(100).to(torch.device("xpu:1"))

# Start profiler as normal
with torch.profiler.profile(activities=[torch.profiler.ProfilerActivity.XPU]) as prof:
    # run kernel on "xpu:0"
    b_0 = a_0 + a_0
    # run kernel on "xpu:1"
    b_1 = a_1 + a_1
    # explicitly synchronize all involved devices
    torch.xpu.synchronize(torch.device("xpu:0"))
    torch.xpu.synchronize(torch.device("xpu:1"))

# You may check kernels on difference devices from chrome trace
prof.export_chrome_trace("trace_example_on_multi_device.json")
Result
Using the first script shown above in Use Tool part, you’ll see the result table printed out to the console as below:
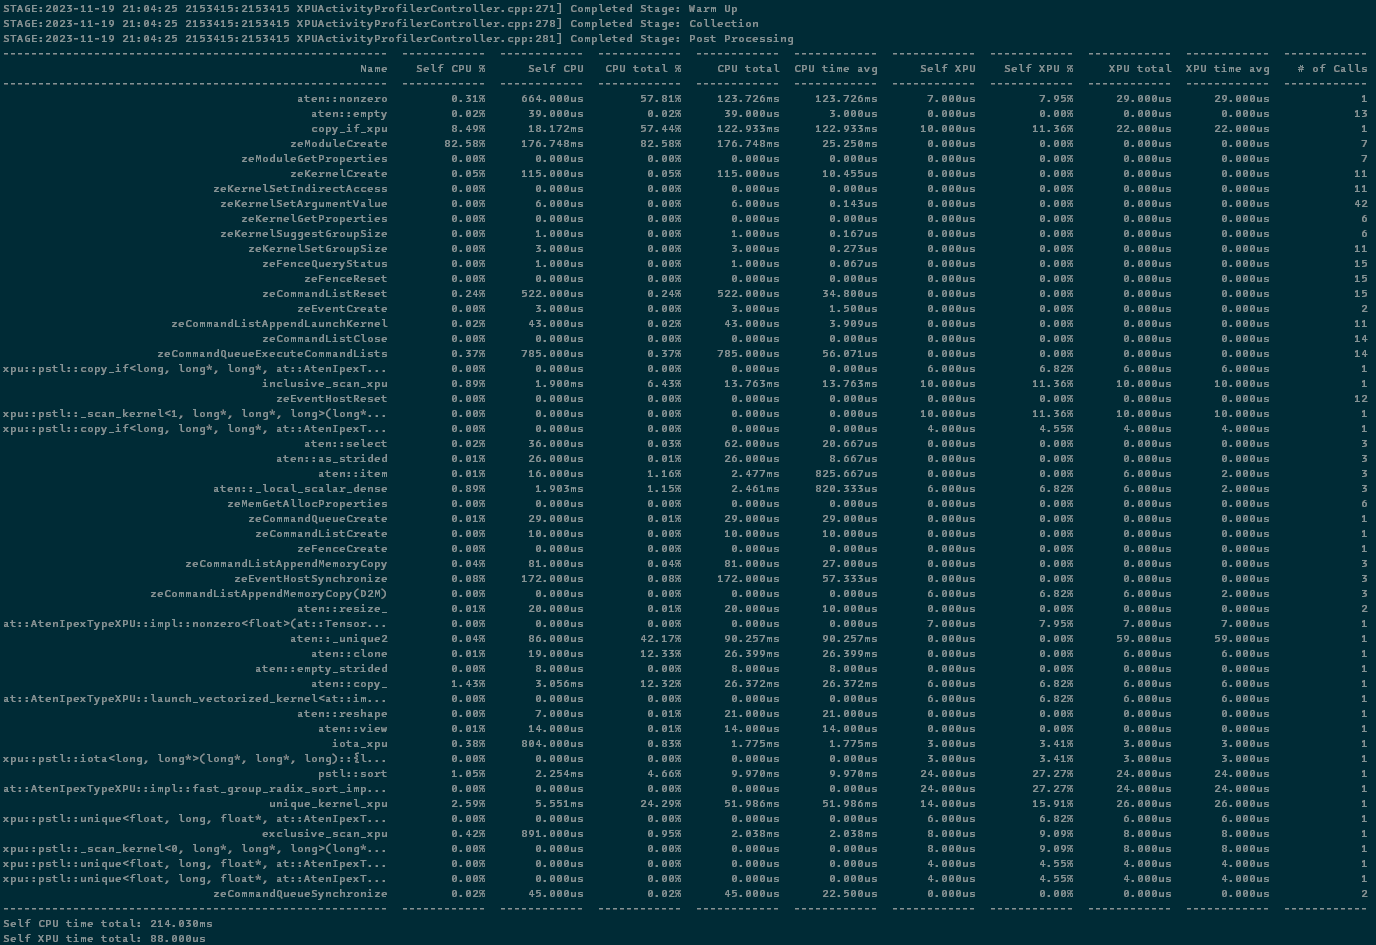
In this result, you can find several fields including:
Name: the name of run operators, runtime functions or kernels.Self CPU %,Self CPU: the time consumed by the operator itself at host excluded its children operator call. The column marked with percentage sign shows the propotion of time to total self cpu time. While an operator calls more than once in a run, the self cpu time may increase in this field.CPU total %,CPU total: the time consumed by the operator at host included its children operator call. The column marked with percentasge sign shows the propotion of time to total cpu time. While an operator calls more than once in a run, the cpu time may increase in this field.CPU time avg: the average time consumed by each once call of the operator at host. This average is calculated on the cpu total time.Self XPU,Self XPU %: similar toSelf CPU (%)but shows the time consumption on XPU devices.XPU total: similar toCPU totalbut shows the time consumption on XPU devices.XPU time avg: similar toCPU time avgbut shows average time sonsumption on XPU devices. This average is calculated on the XPU total time.# of Calls: number of call for each operators in a run.
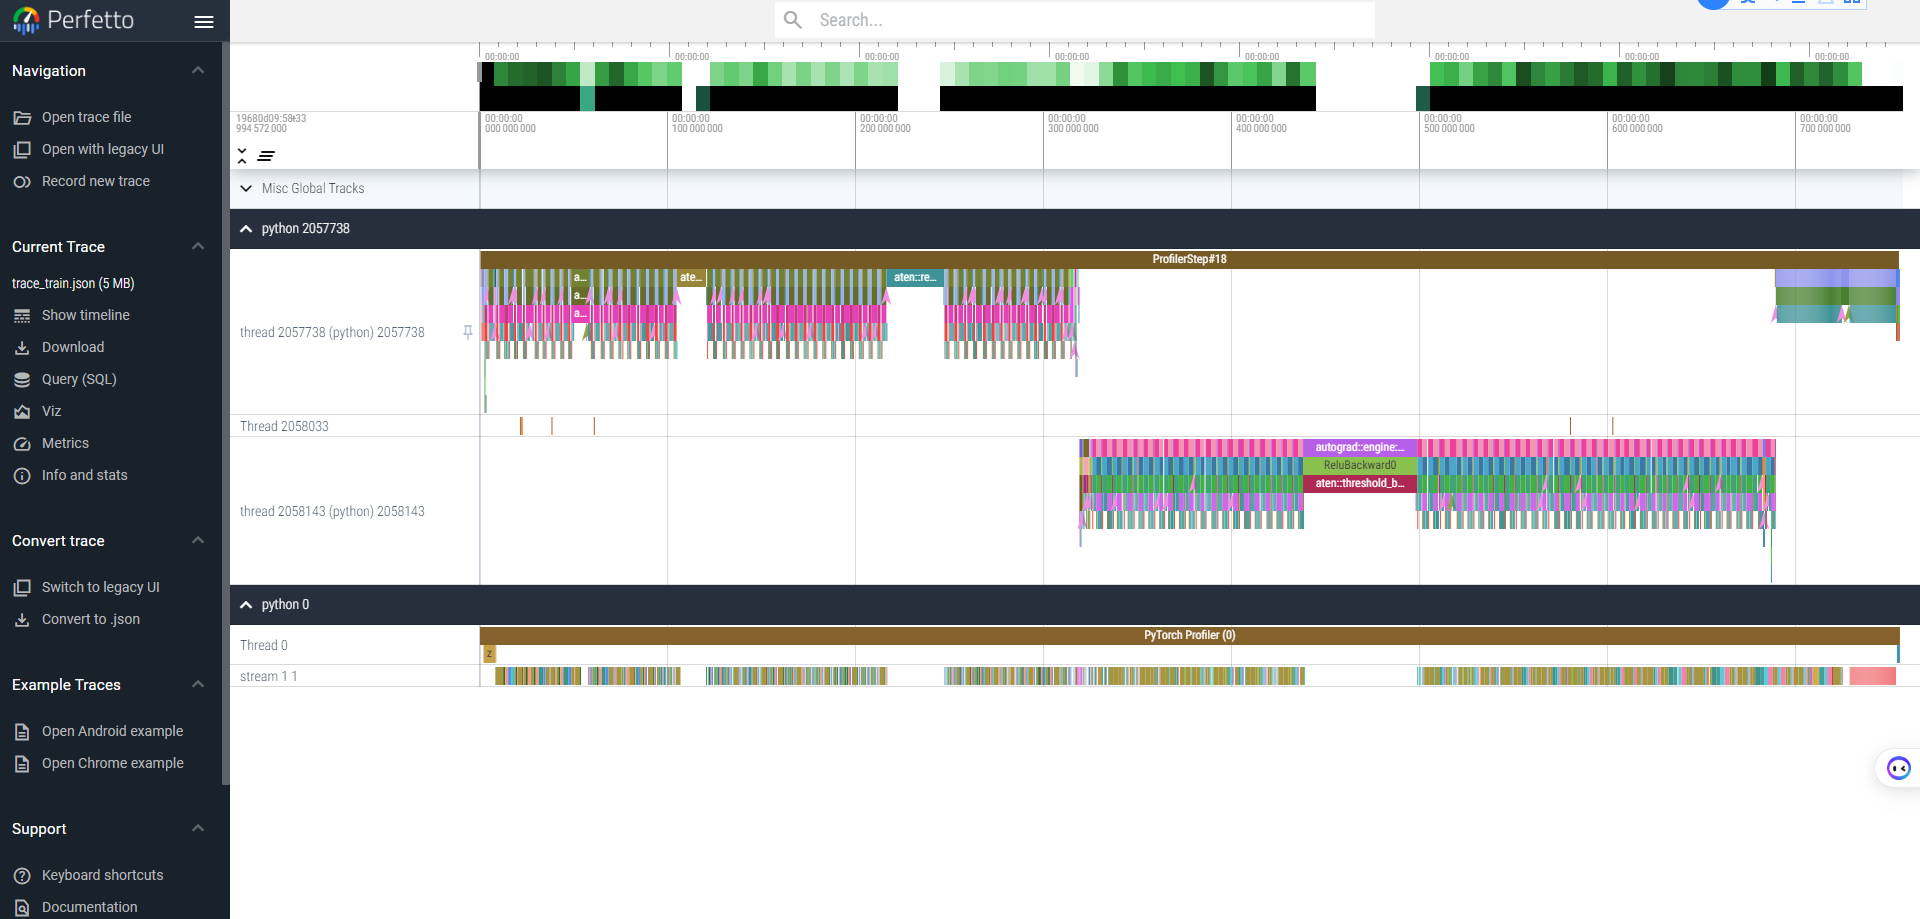
Export to Chrome Trace
You can export the result to a json file and then load it in the Chrome trace viewer (chrome://tracing) or Perfetto viewer (ui.perfetto.dev) by adding this line in your model script:
prof.export_chrome_trace("trace_file.json")
You can examine the sequence of profiled operators, runtime functions and XPU kernels in these trace viewers. Here shows a trace result for ResNet50 run on XPU backend viewed by Perfetto viewer: