Legacy Profiler Tool (Experimental)
Introduction
The legacy profiler tool is an extension of PyTorch* legacy profiler for profiling operators’ overhead on XPU devices. With this tool, users can get the information in many fields of the run models or code scripts. User should build Intel® Extension for PyTorch* with profiler support as default and enable this tool by a with statement before the code segment.
Use Case
To use the legacy profiler tool, you need to build Intel® Extension for PyTorch* from source or install it via prebuilt wheel. You also have various methods to disable this tool.
Build Tool
The build option BUILD_PROFILER is switched on as default but you can switch it off via setting BUILD_PROFILER=OFF while building Intel® Extension for PyTorch* from source. With BUILD_PROFILER=OFF, no profiler code will be compiled and all python scripts using profiler with XPU support will raise a runtime error to user.
[BUILD_PROFILER=ON] python setup.py install     # build from source with profiler tool
BUILD_PROFILER=OFF python setup.py install      # build from source without profiler tool
Use Tool
In your model script, write with statement to enable the legacy profiler tool ahead of your code snippets, as shown in the following example:
# import all necessary libraries
import torch
import intel_extension_for_pytorch

# these lines won't be profiled before enabling profiler tool
input_tensor = torch.randn(1024, dtype=torch.float32, device='xpu:0')

# enable legacy profiler tool with a `with` statement
with torch.autograd.profiler_legacy.profile(use_xpu=True) as prof:
    # do what you want to profile here after the `with` statement with proper indent
    output_tensor_1 = torch.nonzero(input_tensor)
    output_tensor_2 = torch.unique(input_tensor)

# print the result table formatted by the legacy profiler tool as your wish
print(prof.key_averages().table())
There are a number of useful parameters defined in torch.autograd.profiler_legacy.profile(). Many of them are aligned with usages defined in PyTorch*’s official profiler, such as record_shapes, a very useful parameter to control whether to record the shape of input tensors for each operator. To enable legacy profiler on XPU devices, pass use_xpu=True. For the usage of more parameters, please refer to PyTorch*’s tutorial page.
Disable Tool in Model Script
To disable the legacy profiler tool temporarily in your model script, pass enabled=False to torch.autograd.profiler_legacy.profile():
with torch.autograd.profiler_legacy.profile(enabled=False, use_xpu=True) as prof:
    # as `enabled` is set to false, the profiler won't work on these lines of code
    output_tensor_1 = torch.nonzero(input_tensor)
    output_tensor_2 = torch.unique(input_tensor)

# This print will raise an error to user as the profiler was disabled
print(prof.key_averages().table())
Results
Using the script shown above in Use Tool part, you’ll see the result table printed out to the console as below:
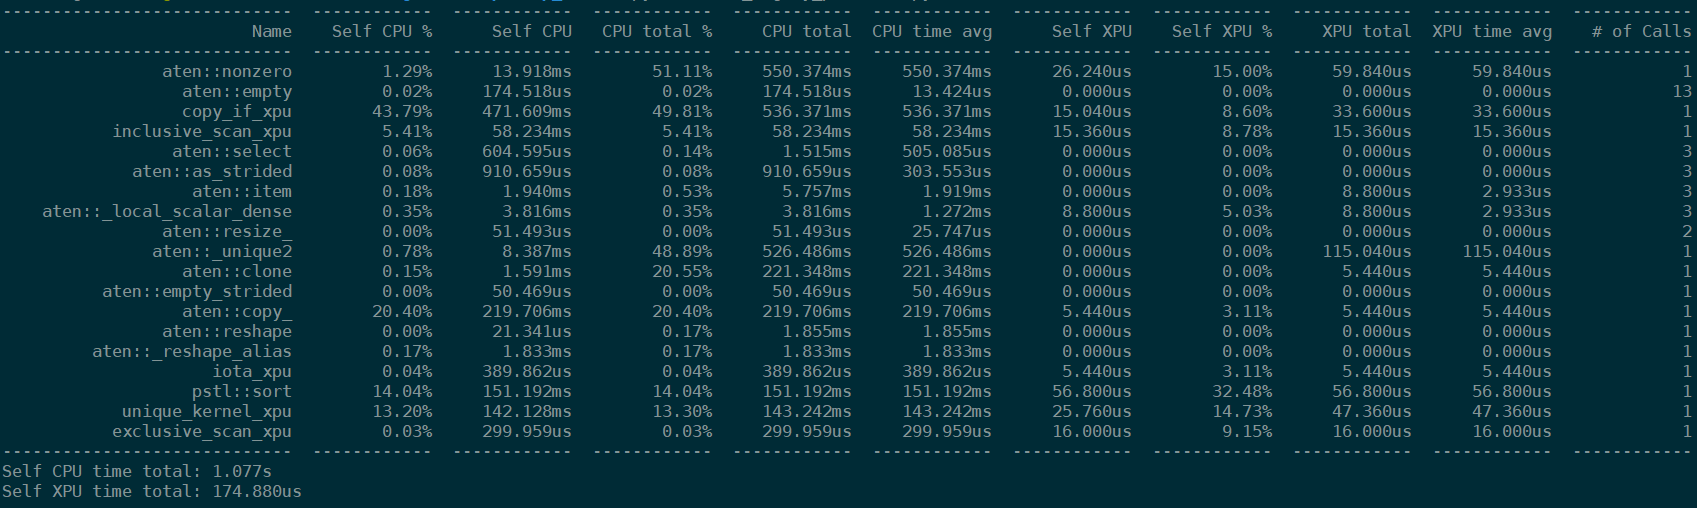
In this result, you can find several fields like:
Name: the name of run operatorsSelf CPU %,Self CPU: the time consumed by the operator itself at host excluded its children operator call. The column marked with percentage sign shows the propotion of time to total self cpu time. While an operator calls more than once in a run, the self cpu time may increase in this field.CPU total %,CPU total: the time consumed by the operator at host included its children operator call. The column marked with percentasge sign shows the propotion of time to total cpu time. While an operator calls more than once in a run, the cpu time may increase in this field.CPU time avg: the average time consumed by each once call of the operator at host. This average is calculated on the cpu total time.Self XPU,Self XPU %: similar toSelf CPU (%)but shows the time consumption on XPU devices.XPU total: similar toCPU totalbut shows the time consumption on XPU devices.XPU time avg: similar toCPU time avgbut shows average time sonsumption on XPU devices. This average is calculated on the XPU total time.# of Calls: number of call for each operators in a run.
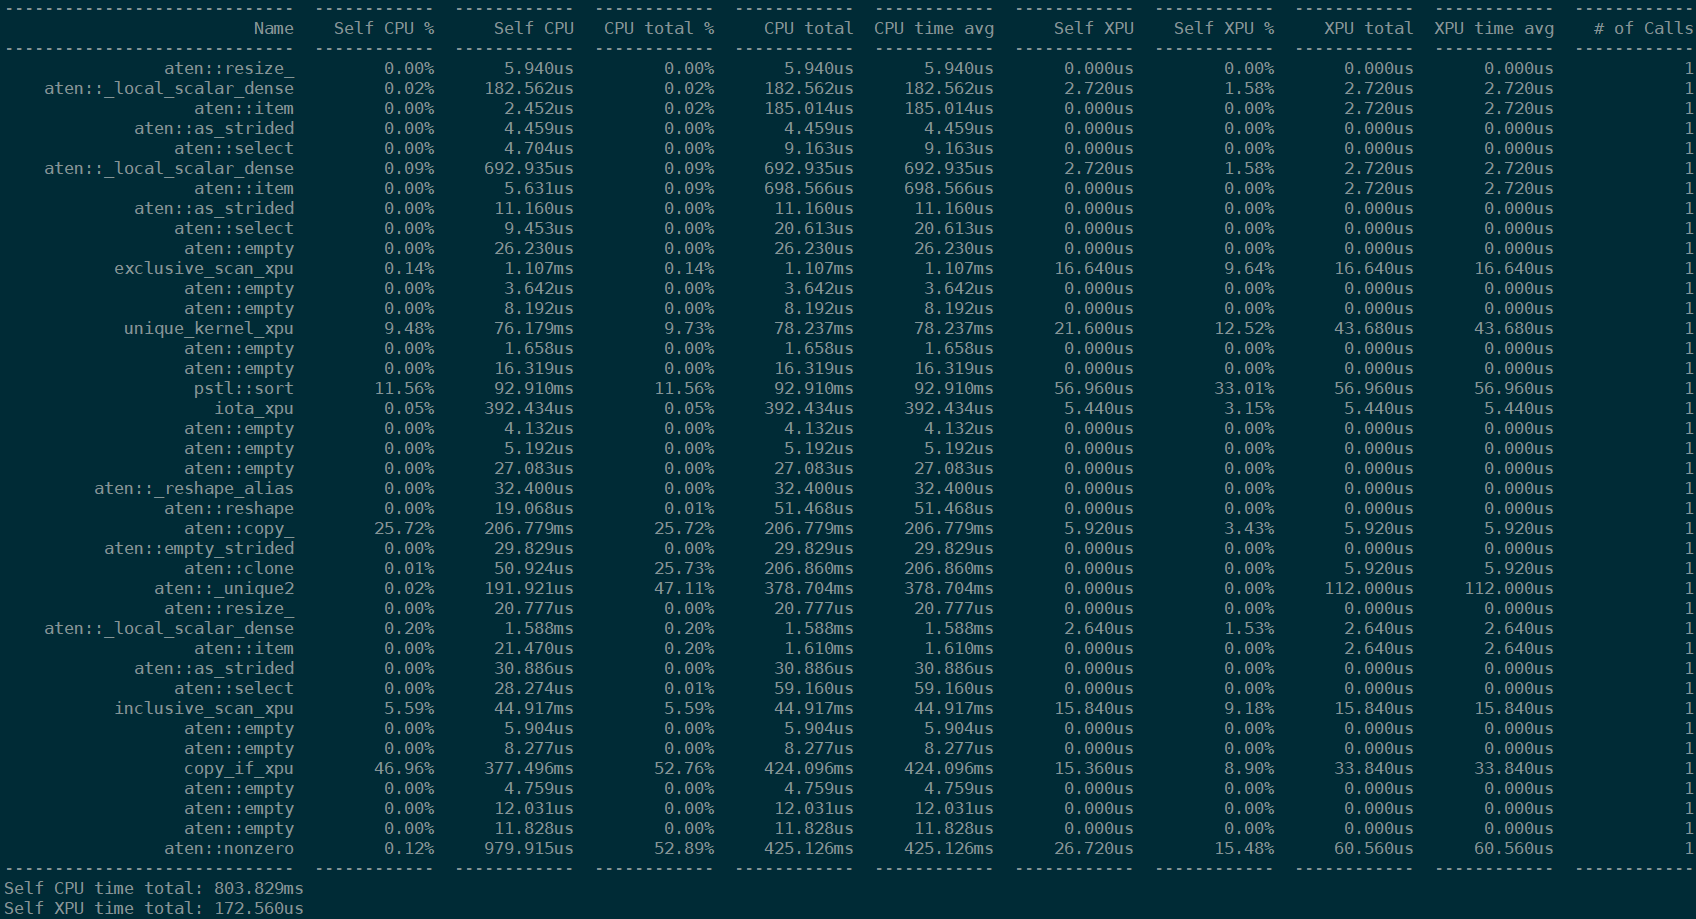
You can print result table in different styles, such as sort all called operators in reverse order via print(prof.table(sort_by='id')) like:
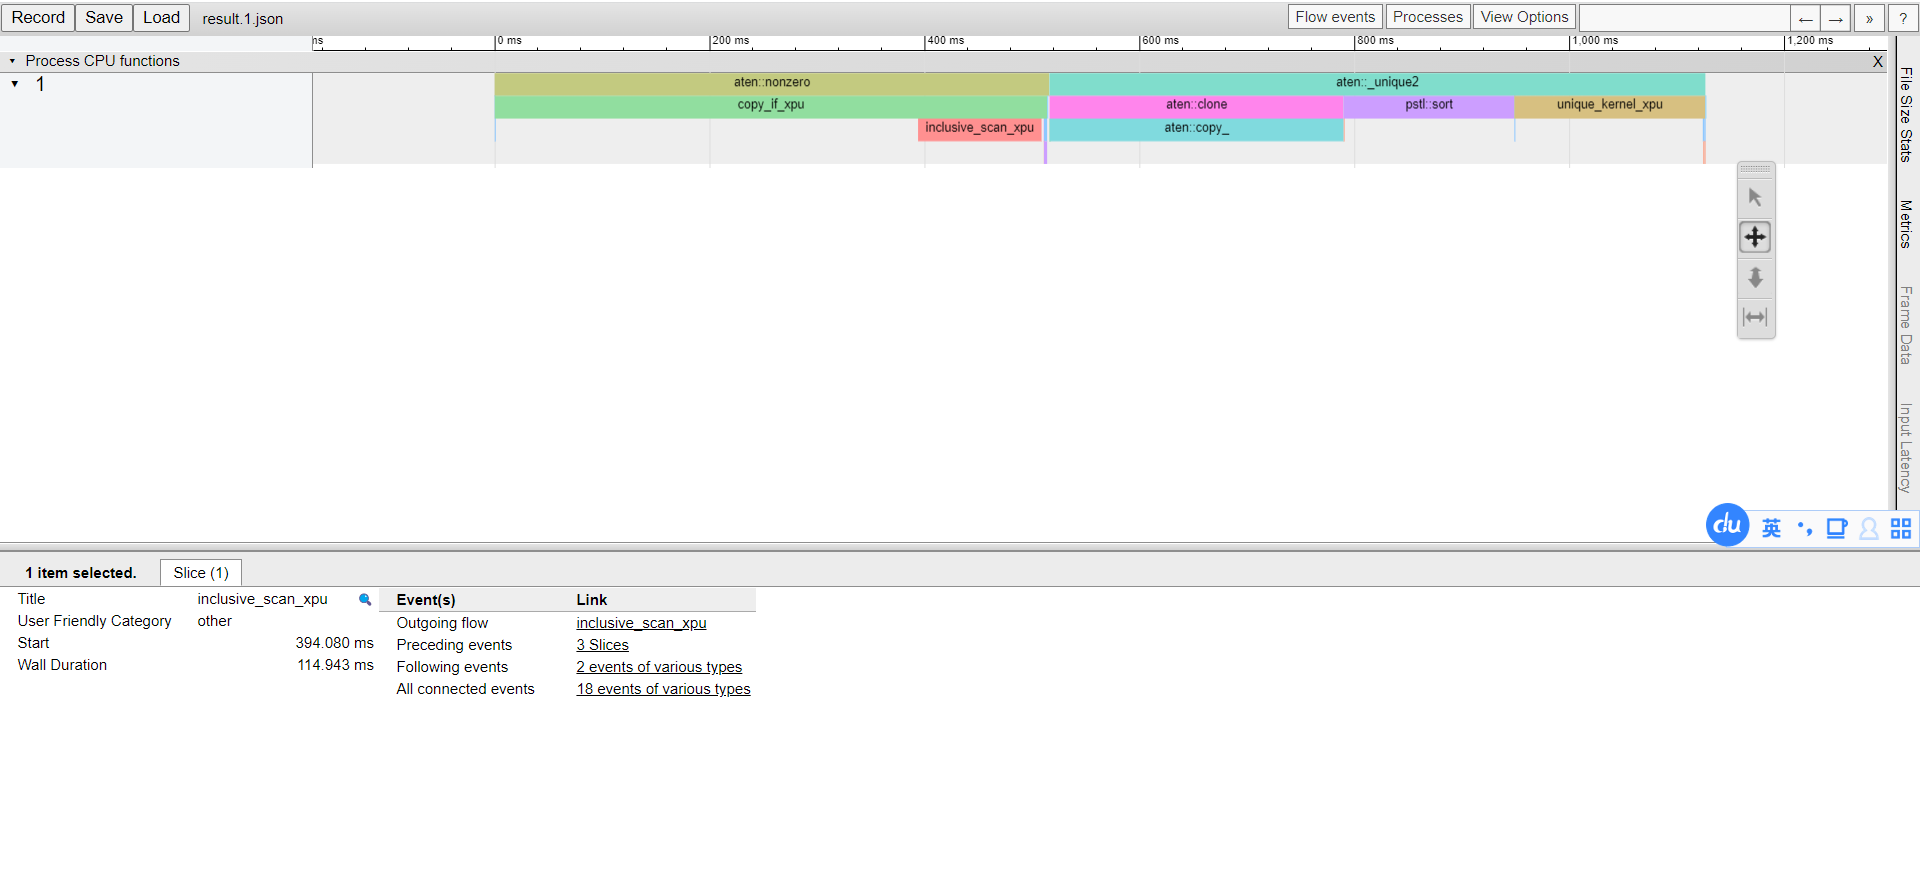
Export to Chrome Trace
You can export the result to a json file and then load it in the Chrome trace viewer (chrome://tracing) by add this line in your model script:
prof.export_chrome_trace("trace_file.json")
In Chrome trace viewer, you may find the result shows like:
For more example results, please refer to PyTorch*’s tutorial page.