Key Features#
Identifying Specialization#
CBI is currently limited to identifying two forms of specialization:
Different source files are compiled for different platforms;
Lines of code within source files are guarded by C preprocessor macros.
Although limited, this functionality is sufficient to support analysis of many HPC codes, and CBI has been tested on C, C++, CUDA and some Fortran code bases.
Computing Code Divergence#
CBI computes code divergence by building a specialization tree, like the one shown below:
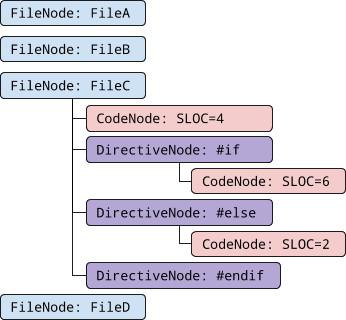
CBI can then walk and evaluate this tree for different platform definitions, to produce a divergence report providing a breakdown of how many lines of code are shared between different platform sets.
---------------------------------------------
                      Platform Set LOC % LOC
---------------------------------------------
                                {}   2  4.88
                           {GPU 1}   1  2.44
                           {GPU 2}   1  2.44
                           {CPU 2}   1  2.44
                           {CPU 1}   1  2.44
                            {FPGA}  14 34.15
                    {GPU 2, GPU 1}   6 14.63
                    {CPU 1, CPU 2}   6 14.63
{FPGA, CPU 1, GPU 2, GPU 1, CPU 2}   9 21.95
---------------------------------------------
Code Divergence: 0.55
Unused Code (%): 4.88
Total SLOC: 41
Future releases of CBI will provide additional ways to visualize the results of this analysis, in order to highlight exactly which lines of code correspond to different platform sets.
Hierarchical Clustering#
Since code divergence is constructed from pair-wise distances, CBI can also produce a pair-wise distance matrix, showing the ratio of platform-specific code to code used by both platforms.
Distance Matrix
-----------------------------------
      FPGA CPU 1 GPU 2 GPU 1 CPU 2
-----------------------------------
 FPGA 0.00  0.70  0.70  0.70  0.70
CPU 1 0.70  0.00  0.61  0.61  0.12
GPU 2 0.70  0.61  0.00  0.12  0.61
GPU 1 0.70  0.61  0.12  0.00  0.61
CPU 2 0.70  0.12  0.61  0.61  0.00
-----------------------------------
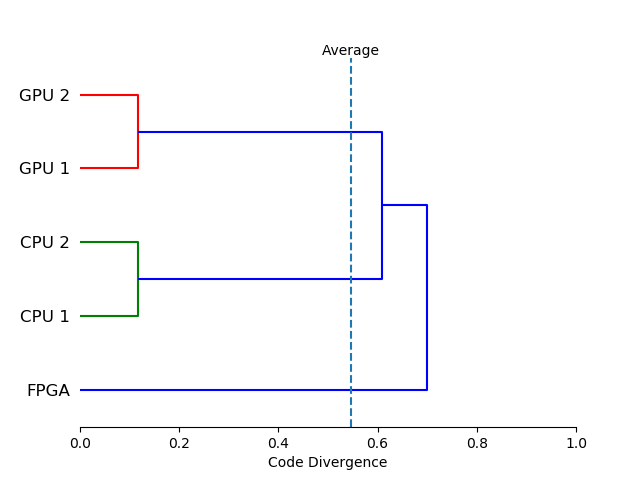
These distances can also be used to produce a dendrogram, showing the result of hierarchical clustering by platform similarity.