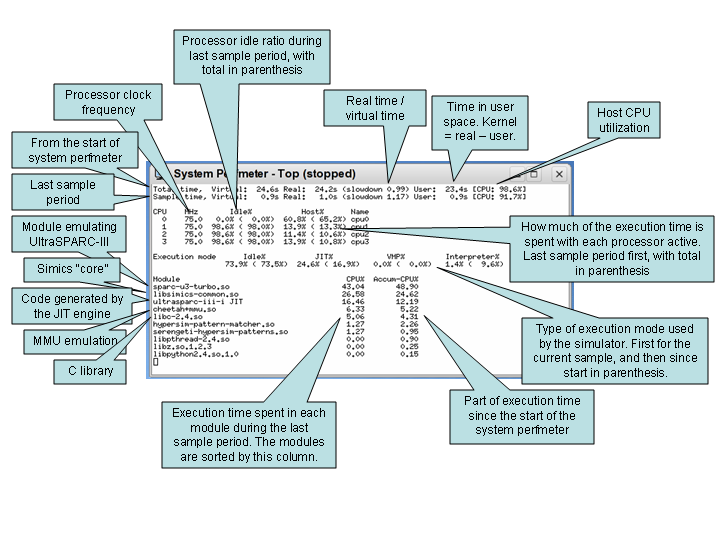
Figure 30. Annotated output from
system-perfmeter -top -module-profile -cpu-exec-mode
The system-perfmeter extension can be used to understand the performance you get out of Simics. The system-perfmeter is sample based, which means that you can see the performance during the workload execution, and how it varies, not only the end result when a workload is finished.
The easiest way to try it out is simply to issue the system-perfmeter command without any additional arguments:
simics> system-perfmeter
This will cause a sample to be taken every 1.0 virtual seconds. For each sample the system-perfmeter extracts various counters from Simics and displays the delta since last time. The output can look like this:
simics> c
SystemPerf: Total-vt Total-rt Sample-vt Sample-rt Slowdown  CPU Idle
SystemPerf: -------- -------- --------- --------- -------- ---- ----
SystemPerf:     1.0s     6.0s     1.00s     5.99s     5.99  97%   0%
SystemPerf:     2.0s     6.7s     1.00s     0.69s     0.69  97%   0%
SystemPerf:     3.0s     8.0s     1.00s     1.34s     1.34  92%   0%
SystemPerf:     4.0s     8.4s     1.00s     0.42s     0.42 100%   0%
SystemPerf:     5.0s     9.2s     1.00s     0.78s     0.78  98%  14%
SystemPerf:     6.0s    10.5s     1.00s     1.31s     1.31  96%  55%
SystemPerf:     7.0s    10.7s     1.00s     0.12s     0.12  92%  93%
SystemPerf:     8.0s    10.7s     1.00s     0.00s     0.00 100% 100%
Here we can see the execution for the first 8 virtual seconds and the corresponding performance measured in each second sample. To simulate these 8 virtual seconds, it took Simics 10.7 host seconds, thus the average slowdown is 1.34.
The CPU column shows how much of the host CPU that Simics has
used, allowing you to notice if there is another process consuming the
host CPU resources. Another reason for CPU utilization to be low can
be that Simics itself is running in real-time mode where Simics sleeps
so that virtual time does not race ahead of host time.
When an 'idle' condition has been detected (see chapter 15.4.1), the total idleness of the system is
reported in the Idle column. If the simulated system
consists of multiple processors and you wish to see how much each
processor is idling you can use the -cpu-idle switch to
system-perfmeter. Note that idling is defined by the
simulator, not by the target architecture (see chapter
15.4.1). With
the -cpu-exec-mode, information is also gathered and
printed on how simulation steps are executed in the CPU model. The
fastest mode to be executing in is idle, followed by VMP, JIT, and
interpreter.
The system-perfmeter can also be used to get an understanding of which processor that takes the longest time to simulate. The -cpu-host-ticks switch adds extra columns per CPU for this. For example:
SystemPerf: Total-vt Total-rt Sample-vt Sample-rt Slowdown  CPU Idle [   0   1   2   3 ]
SystemPerf: -------- -------- --------- --------- -------- ---- ----   --- --- --- ---
SystemPerf:     1.0s    15.6s     1.00s    15.63s     15.6  99%  74% [  71  11  11   8 ]
SystemPerf:     2.0s    32.6s     1.00s    16.97s     17.0  98%  72% [  70  11  10   9 ]
Here we have a 4 CPU system which is idle roughly 70% and the last columns show that CPU0 takes 70% of the time to simulate, while the other three about 10% each. Hence CPU0 is working while the other CPUs are idling.
The -module-profile flag enables live profiling of the main
Simics thread. The profiling is sample based, and any sample hitting
in code produced dynamically by a JIT engine will be reported as
"classname JIT". The -module-profile
data is not printed in the standard line print mode, so you must use
either -top or -summary to get profiling
information.
Figure 30 explains the output of system-perfmeter. There are many other options to the system-perfmeter command, please read the associated help text for details.
simics> help system-perfmeter