GPU Profiler
Usage
Intel® Extension for TensorFlow* provides support for TensorFlow* Profiler, and is enabled by exposing three environment variables (export ZE_ENABLE_TRACING_LAYER=1, export UseCyclesPerSecondTimer=1, export ENABLE_TF_PROFILER=1).
You use the profiler for tracking the performance of the TensorFlow* models running on the Intel GPU.
The GPU profiler supports the following profiling items:
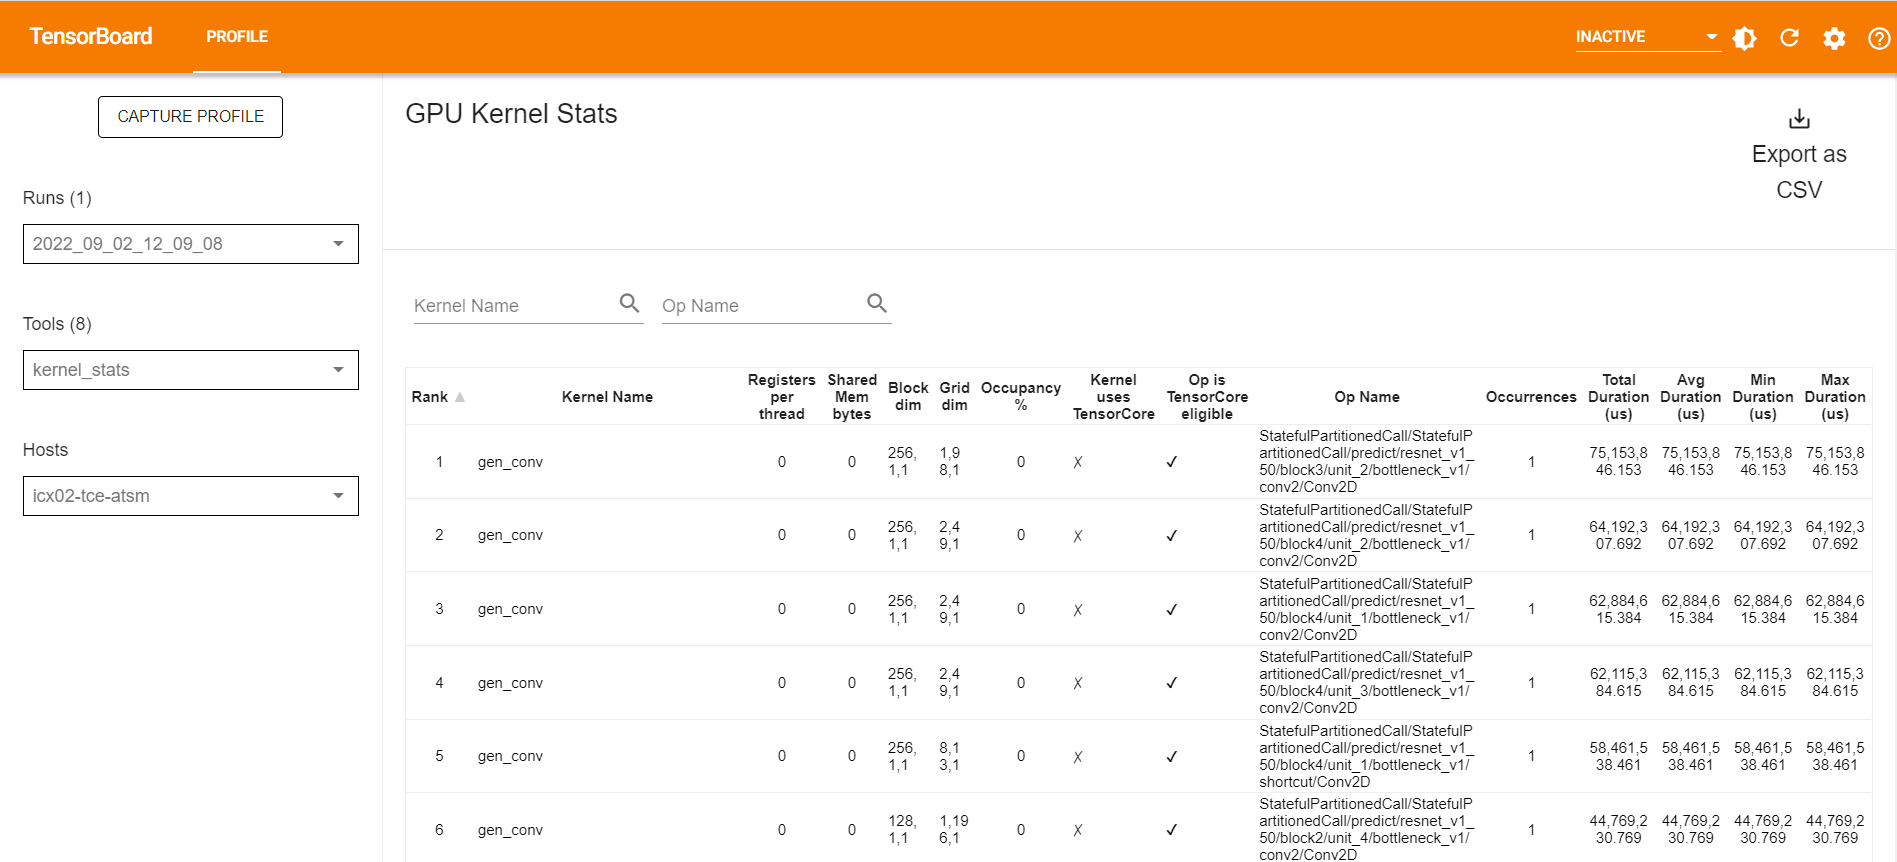
kernel_stats
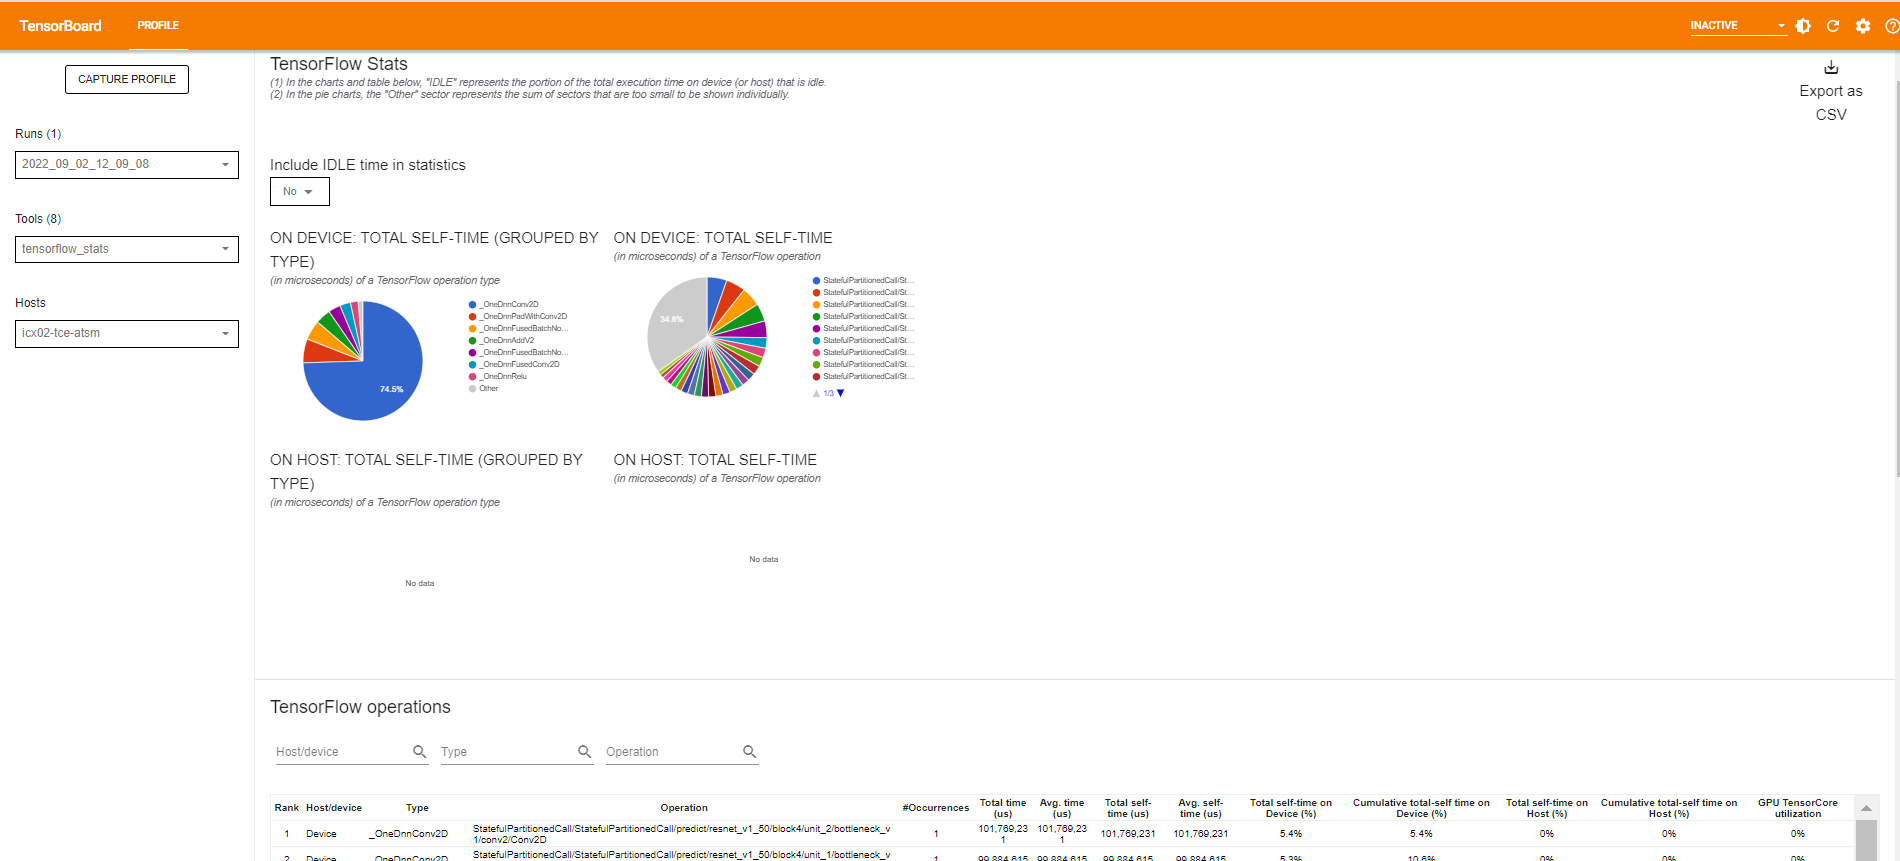
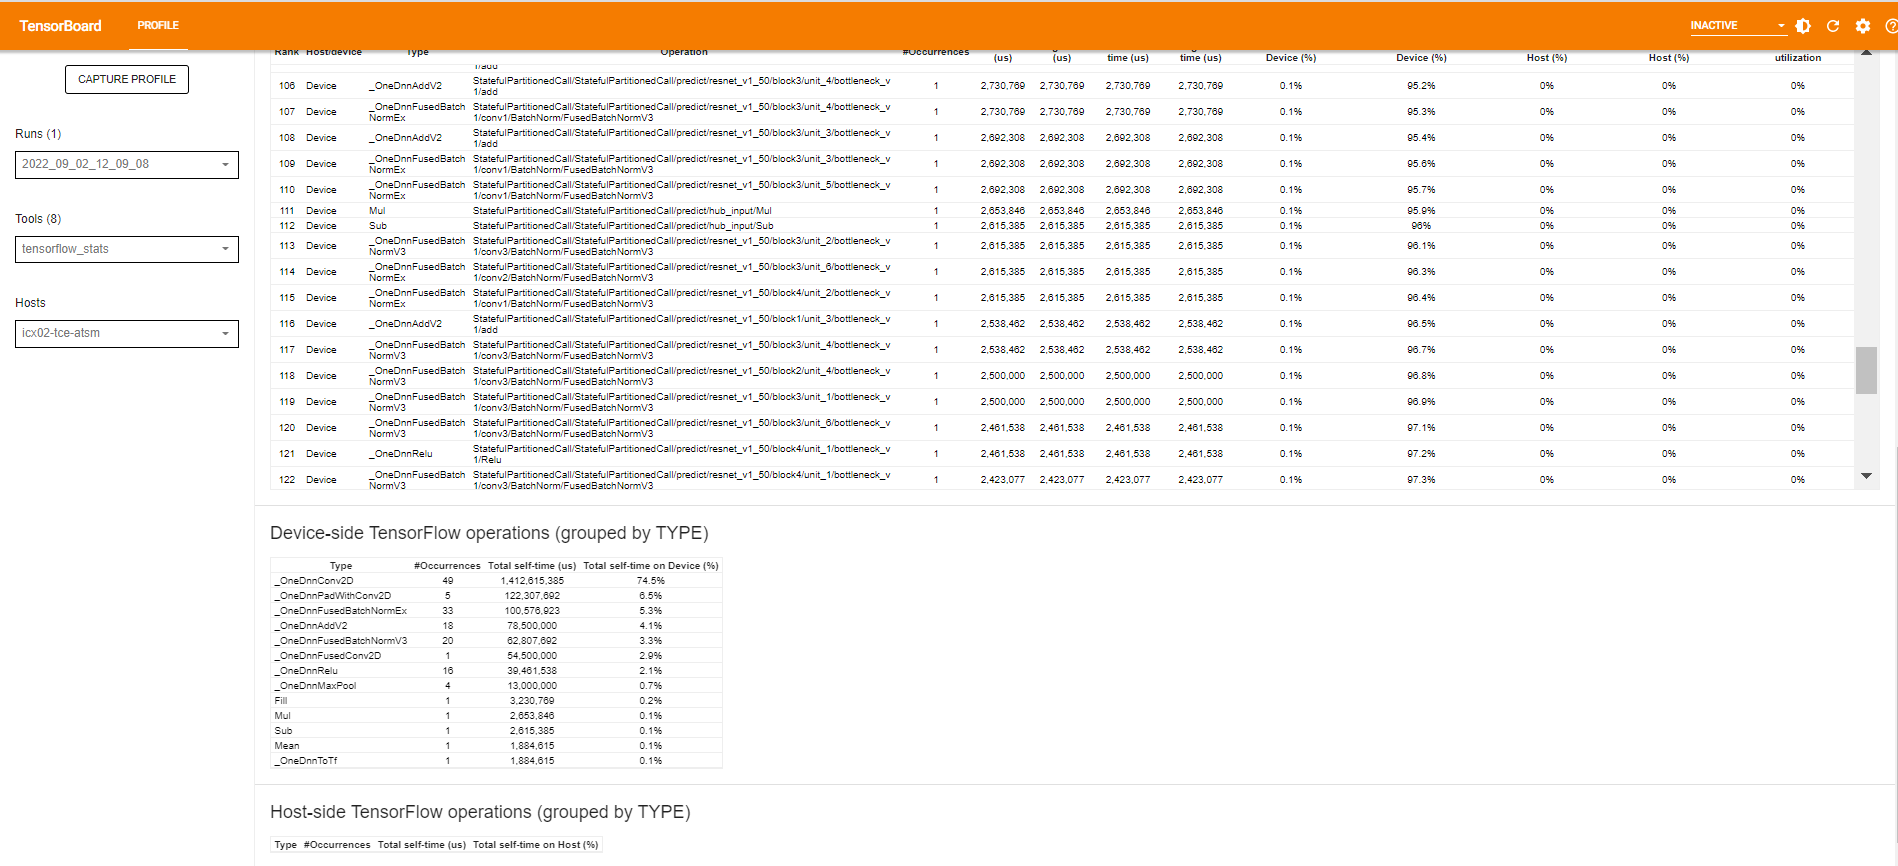
tensorflow_stats
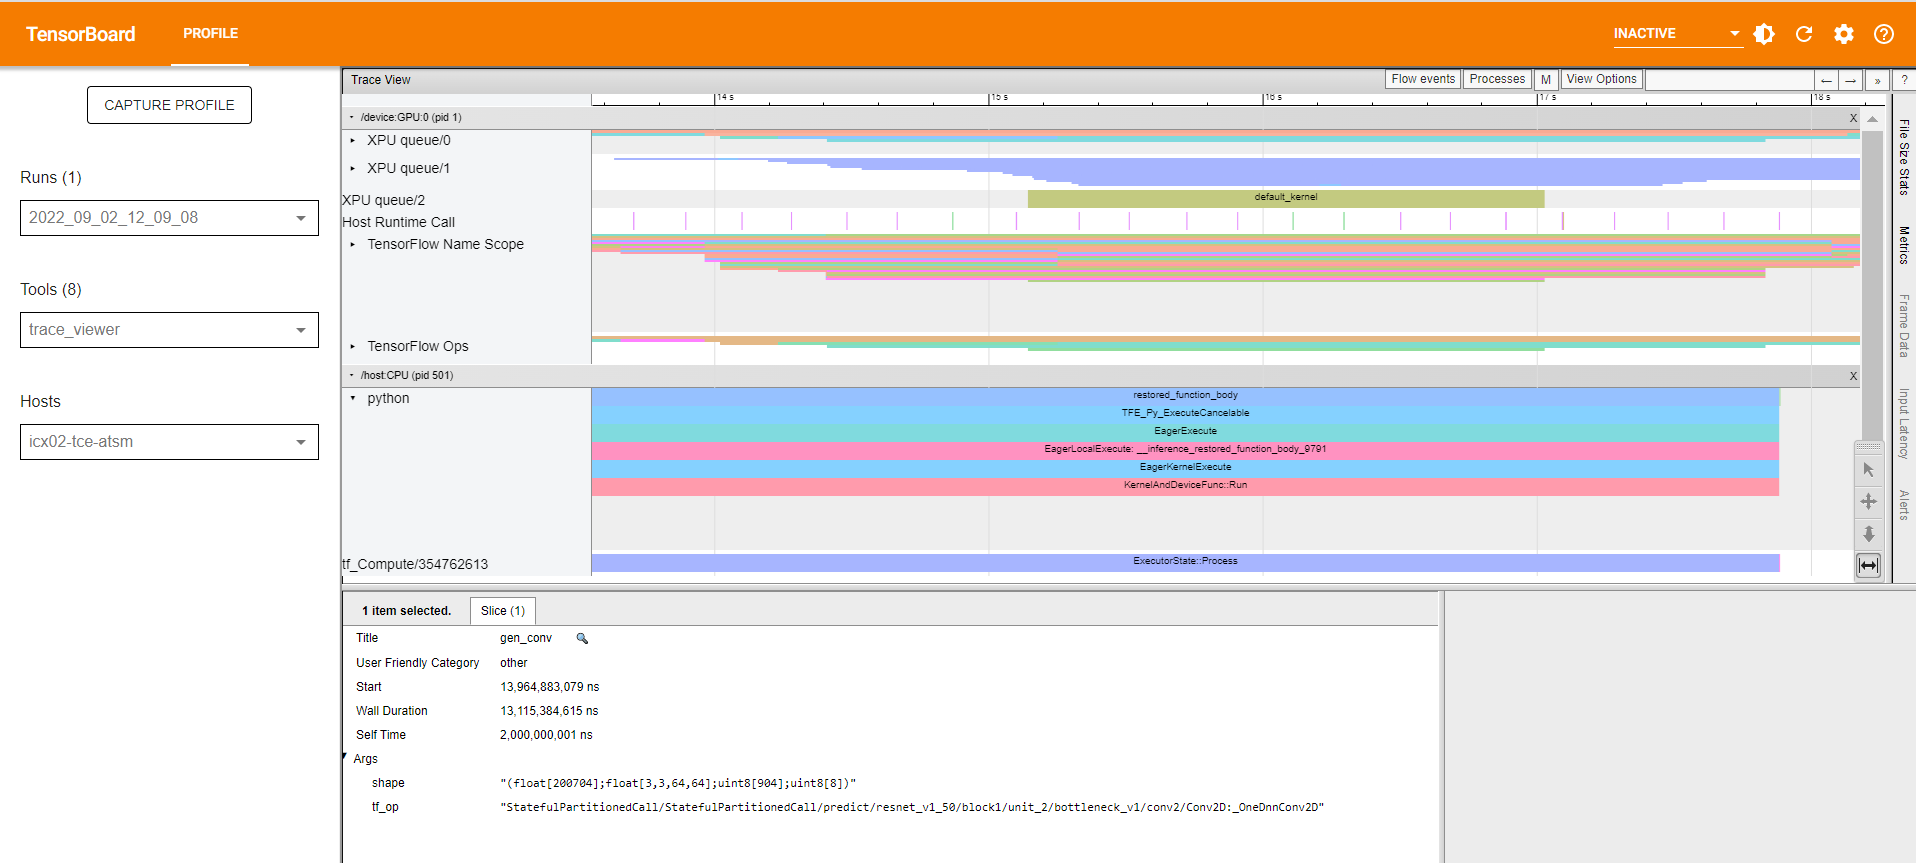
trace_viewer
Example:
requirements:
pip install tensorflow_hub
pip install -U tensorboard-plugin-profile
script:
import tensorflow as tf
import numpy as np
import os
import tensorflow_hub as tf_hub

logpath = os.path.join('data', 'logs',  'profiler_demo')
tf.debugging.set_log_device_placement(True)

model = tf_hub.KerasLayer('https://tfhub.dev/google/imagenet/resnet_v1_50/classification/5')

input = tf.ones((1, 224, 224, 3))

with tf.device("/XPU:0"):
    # Warm up
    model(input)

    tf.profiler.experimental.start(logpath)
    model(input)
    tf.profiler.experimental.stop()

print('done')
run:
$ export ZE_ENABLE_TRACING_LAYER=1
$ export UseCyclesPerSecondTimer=1
$ export ENABLE_TF_PROFILER=1
python test.py
Run TensorBoard:
After executing the above sample code, you will find the log files in ./data/logs/profiler_demo, run TensorBoard with following command:tensorboard --logdir=./data/logs/profiler_demo --bind_all
Analyze the result from the Profile tab:
kernel_stats:
tensorflow_viewer:
trace_viewer:
FAQ
1.If you see “No dashboards are activate for the current data set.” the first time you enter the Tensorboard in the browser.
Refresh the page, and the profile should be shown.