This section describes the Instrumentation Framework in Simics.
Simics' instrumentation framework provides a mechanism for inspecting various parts of the running simulated system and features a flexible way to dynamically add/remove inspections. The framework is designed with performance in mind, allowing fast and parallel execution with low latency communication.
Unlike most profiling tools, which instrument the target source code or object code, Simics can profile a workload non-intrusively. This allows you to profile without disturbing the execution. Simics will profile arbitrary code, including device drivers, dynamically generated code, and code for which you do not have the source. Also, unlike most profiling tools, Simics collects profiling data exactly, not by sampling the execution and relying on statistics.
What information that can be obtained through the instrumentation framework depends on how well the devices and other objects have been adapted to this new framework. Since the framework is new, only some models support instrumentation through various interfaces:
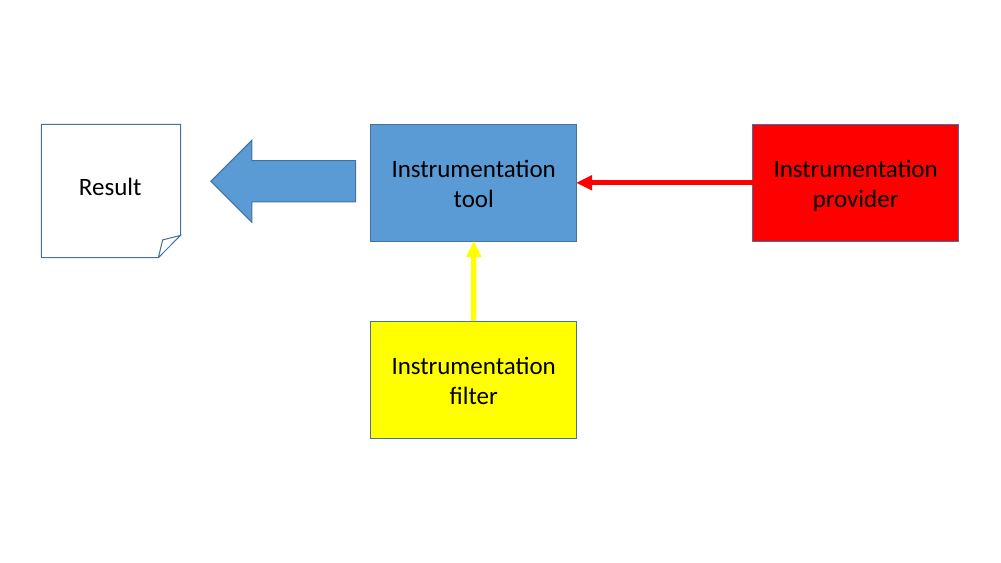
Conceptually, Simics instrumentation framework consists of four elements:
Figure 4 shows an abstract view of a possible setup. The instrumentation provider sends information through an instrumentation connection to the tool. The instrumentation filter can decide to disable the gathering of information from the provider. At any point within the simulation the tool can produce output for the user on what it has collected.

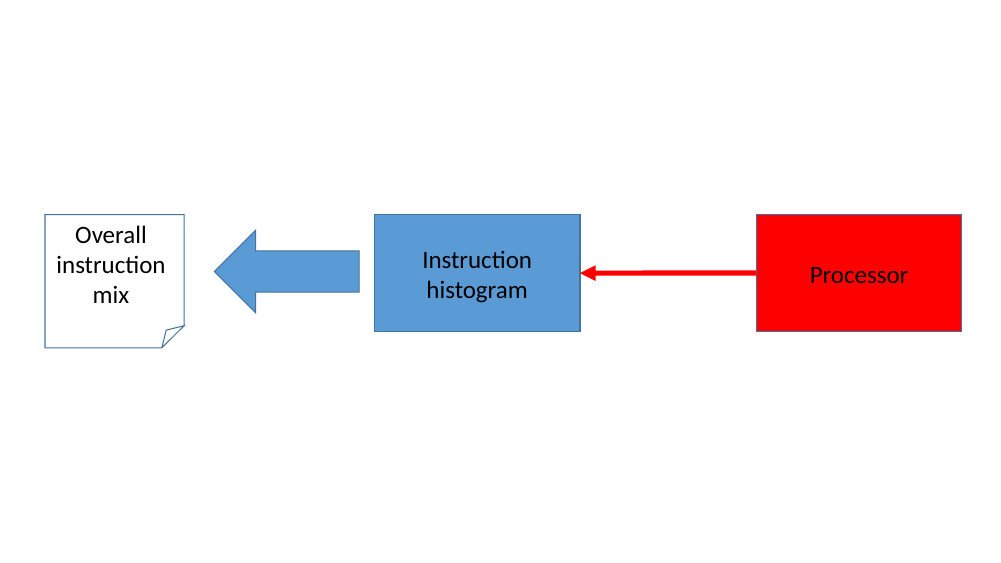
To concretize the abstract example in a more realistic setup, figure 5 shows an "instruction-histogram" tool which counts the instructions being executed and their frequency, producing a histogram of the most commonly used instructions that were executed on this processor (system-wide, that is, both instructions in the operating system, kernel threads, and all user-level processes are counted).
If only a specific application's instruction mix is of interest, we can add a filter to this setup. In figure 6, a process-filter has been setup to monitor the 'perl' application only. The process-filter uses the OS-Awareness feature in Simics to get information when any perl process is created, scheduled on a certain cpu, or die. With this knowledge, the process-filter enables and disables the instruction-histogram collection. The output from the instruction-histogram is now only the instruction mix for the perl application(s) that has executed.
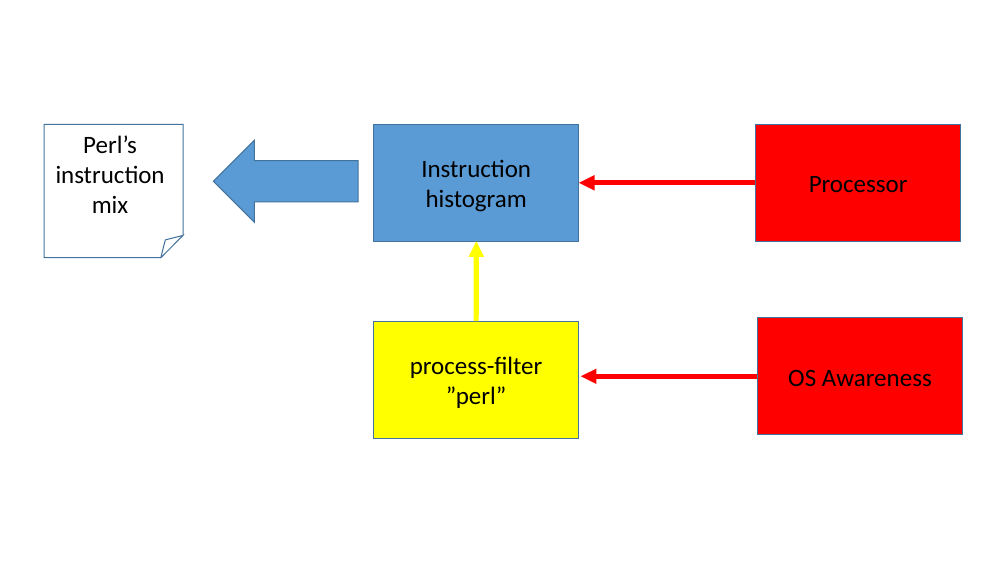
Filters are orthogonal to the tools, and the tools are themselves unaware of any existing filters controlling them. From the tool perspective, it is simply someone requesting their connections to be disabled or enabled.
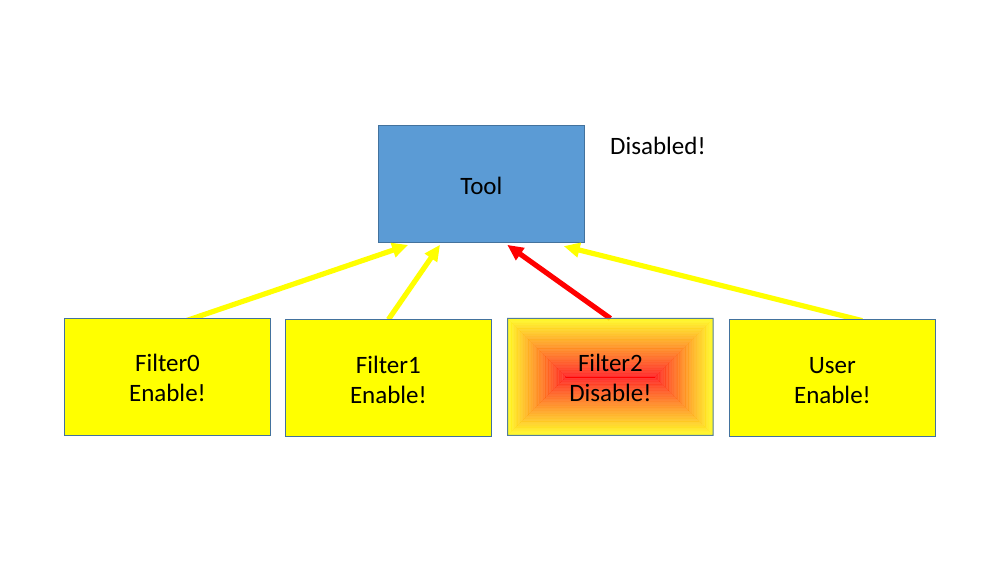
It is possible to have multiple filters controlling one tool as shown in figure 7. This allows sophisticated setups for zooming in a specific details of the instrumentation gathered.
In principle, all tools always have one filter: the user, which can use Simics commands to enable or disable the communication manually, in a script or in a script-branch. By using enable/disable commands in a script branch, the user have the possibility to control when the instrumentation should be active based on virtual-time, breakpoints triggered etc.
As long as all filters enables the tool's connection, it will be active.
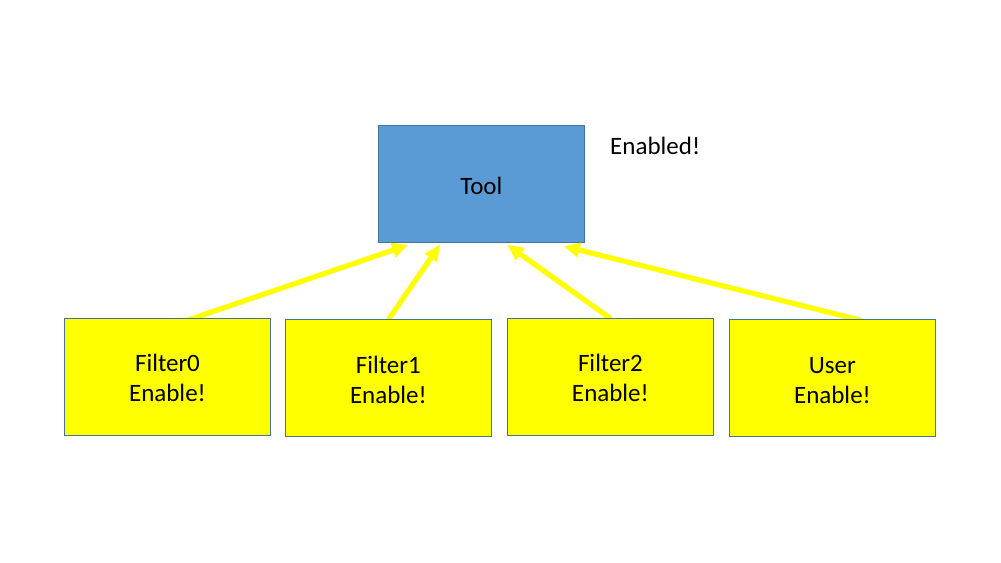
But as shown in figure 8 when any filter decides to disable the connection it will become disabled and remain so until all filters have enabled it again.
How providers and tools are allowed to be connected depends on the tool's requirements of the providers interfaces. That is, some tools can only connect to certain providers.
It is possible to connect:
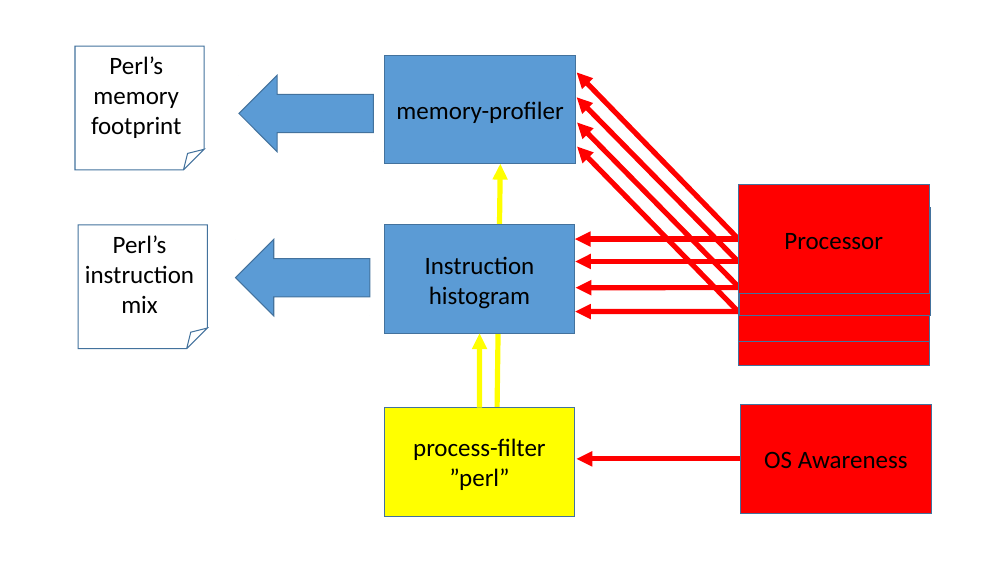
An even more advanced example is illustrated the in figure 9. In this setup, there are two tools working simultaneously, both are connected to the same SMP cluster of processors and both are using the same filter which tracks the 'perl' application.
