Simics provides extensive support for tracing and modifying memory transactions coming out of a processor. This chapter aims at describing how to access memory transactions programmatically to write extensions such as trace tools, timing models or cache simulation.
All processor models in Simics offer an interface that provides a registered listener with all executed instructions. This is used by the trace module, among others, to produce its execution trace.
Registering a function to listen to a trace interface is simple. Assuming that cpu is the traced processor, the following code will register the function trace_listener() to be called for each instruction executed by cpu:
void *data_for_trace_listener = some_data;
const exec_trace_interface_t *iface =
        SIM_c_get_interface(cpu, EXEC_TRACE_INTERFACE);
iface->register_tracer(cpu, trace_listener, data_for_trace_listener);
Turning off tracing is just as simple:
void *data_for_trace_listener = some_data;
const exec_trace_interface_t *iface =
        SIM_c_get_interface(cpu, EXEC_TRACE_INTERFACE);
iface->unregister_tracer(cpu, trace_listener, data_for_trace_listener);
The listener function itself is expected to be defined as an instruction_trace_callback_t, defined as follow:
typedef void (*instruction_trace_callback_t)(lang_void *tracer_data,
                                             conf_object_t *cpu,
                                             linear_address_t la,
                                             logical_address_t va,
                                             physical_address_t pa,
                                             byte_string_t opcode);
It takes the following arguments:
tracer_data when registering the listener function with register_tracker(). Tracer functions are not expected to return any value to Simics.
The trace module is provided along with Simics, both as a binary and source code. It is an excellent starting point for developing new tracing modules.
This section expects the reader to be familiar with memory spaces and how memory accesses are directed to the correct device or memory. More information on memory spaces is available in chapter 23.
Memory-spaces provide a memory hierarchy interface for observing and modifying memory transactions passing through them. This interface is in fact composed of two different interfaces acting at different phases of a memory transaction execution:
The timing_model interface provides access to a transaction before it has been executed (i.e., it has just arrived at the memory-space).
To connect an object to the timing model interface, just set the timing_model attribute of the corresponding memory-space with the value of the object you want to connect:
simics> @conf.phys_mem0.timing_model = conf.listening_object
The timing model interface can also be used to change the timing and the execution of a memory transaction, as well as to modify the value of a store going to memory. This is described in more detail in section 43.3.2.
The snoop_memory interface provides access to a transaction after it has been executed.
Connecting an object to the snoop memory interface is done in the same way as for the timing model interface:
simics> @conf.phys_mem0.snoop_device = conf.listening_object
The trace module, for example, automatically connects itself (or rather one of its objects) to this interface when a trace is started. The advantage of using this interface is that the value of load operations is accessible, since the operation has already been performed.
The snoop memory interface can also be used to modify the value of a load operation. This is described in more detail in section 43.3.2.
Both interfaces can be used simultaneously, even by the same object. This property is used by the trace module, which is in fact connected both to the timing_model and the snoop_memory interfaces. The reason for this double connection is explained in section 43.2.4.
Information about implementing these two interfaces is available in section 43.2.6 and section 43.3.2.
For performance reasons, instruction fetches are not sent to the memory hierarchy by default.
Instruction fetches can be activated for each processor with the <cpu>.instruction-fetch-mode command. It can take several values:
no-instruction-fetch
No instruction fetches are sent to the memory hierarchy interface.
instruction-cache-access-trace
An instruction fetch is sent every time a different cache line is accessed by the processor. The size of the cache line is set by the processor attribute instruction_fetch_line_size.
This option is meant to be used for cache simulation where successive accesses to the same cache line do not modify the cache state.
instruction-fetch-trace
All instruction fetches are sent to the memory hierarchy interface. This option is often implemented as instruction-cache-access-trace with a line size equal to the size of one instruction.
This option is meant to provide a complete trace of fetch transactions.
Finally, instruction fetch transactions are not generated by all processor models. The section 43.4 contains a summary of which features are available on which models.
For performance reasons, page-table reads are not sent to the memory hierarchy by default on some CPU models. For PPC models with classic MMU, you have to set the mmu_mode attribute to get page-table reads. See the attribute description in the Reference Manual for more information.
In order to improve the speed of the simulation, Simics does not perform all accesses through the memory spaces. The Simulator Translation Caches (STCs) try to serve most memory operations directly by caching relevant information. In particular, an STC is intended to contain the following:
The general idea is that the STC will contain information about "harmless" memory addresses, i.e., addresses where an access would not cause any device state change or side-effect. A particular memory address is mapped by the STC only if:
Memory transactions targeting devices are also mapped by the STC.
The contents of the STCs can be flushed at any time, so models using them to improve speed can not rely on a specific address being cached. They can however let the STCs cache addresses when further accesses to these addresses do not change the state of the model (this is used by cache simulation with g-cache; see the Cache Simulation chapter in the Analyzer User's Guide).
The STCs are activated by default. They can be turned on or off at the command prompt, using the stc-enable/disable functions. An object connected to the timing_model interface can also mark a memory transaction so that it will not be cached by the STCs. For example, the trace module uses that method to ensure that no memory transaction will be cached, so that the trace will be complete.
Note that since information is inserted into the STCs when transactions are executed, only objects connected to the timing model interface can influence the STCs' behavior. The section 43.3 provides a complete description of the changes authorized on a memory transaction when using the memory hierarchy interface.
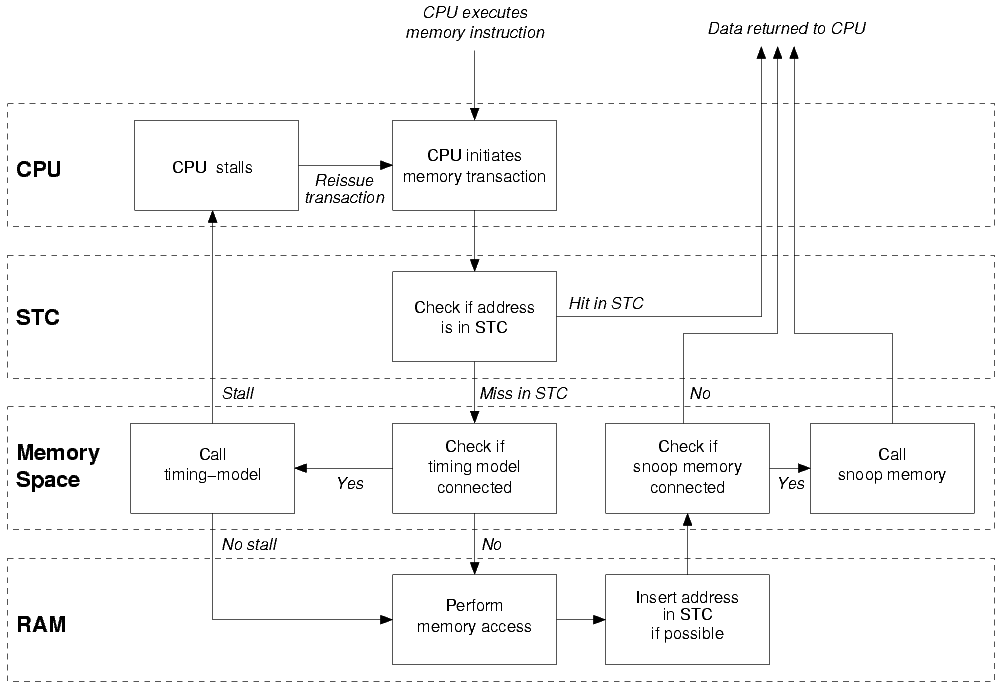
This diagram puts together the concepts introduced in chapter 23. It describes the path followed by a processor transaction through Simics memory system.
The CPU executes a load instruction.
A memory transaction is created.
If the address is in the STC, the data is read and returned to the CPU using the cached information.
If the address is not in the STC, the transaction is passed along to the CPU memory-space.
If a timing-model is connected to the memory-space, it receives the transaction.
The memory-space determines the target object (in this example, a RAM object).
The RAM object receives the transactions and executes it.
If possible, the transaction is inserted in the STC.
If a snoop-memory is connected to the memory-space, it receives the transaction.
The transaction is returned to the CPU with the correct data.
Store operations works in the same way, but no data is returned to the CPU.
Simics's memory system is more complex than what is presented here, but from the point of view of a user timing-model or snoop-memory, this diagram explains correctly at which point the main events happen.
The timing_model and snoop_memory contains only one function called operate():
static cycles_t
my_timing_model_operate(conf_object_t         *mem_hier,
                        conf_object_t         *mem_space,
                        map_list_t            *map_list,
                        generic_transaction_t *mem_op);
The four arguments are:
conf_object_t * mem_hierconf_object_t * mem_spacemem_space argument is the memory space object that the timing model or snooper is connected to. map_list_t * map_listmap_list argument describes the entry in the map attribute list that this memory operation matched (as returned from a call to the space_lookup function in the memory_space interface). generic_transaction_t * mem_opThe return value is the number of cycles the transaction should stall before being executed (or reissued). Returning 0 disables all stalling.
Sometimes it is desirable to chain timing models, e.g., if you are implementing a multi-level cache model and want to model each level of the cache as an individual class. To do this, the operate() function must call the corresponding functions of the lower levels (a lower or next level cache means a cache further away from the CPU, closer to the actual memory).
The g-cache source code included with Simics is an example of how to do this. Whenever there is a miss in the cache, the g-cache object creates a new memory operation and calls the operate() method of the timing_model interface from the next level cache specified by the timing_model attribute.
The precision of the simulation can be improved by adding timing controls for memory operations: memory-related instructions are no longer atomic operations, but actually take virtual time to execute.
Stalling is controlled via the timing_model interface. The interface simply allows the implementer to return a non-zero number of cycles to stall before the transaction is allowed to progress. During this time, the processor is given back control and lets time advance until the transaction's stall time has elapsed. The transaction is then reissued to the memory system.
Stalling a transaction is not always possible, depending on the processor model you are using in the simulation. The section 43.4 explains what is available for each model.
Cache models, described in the Analyzer User's Guide, are good examples of complex timing models. Finally, the Understanding Simics Timing application note goes into more details in the exact way Simics handles timing and multiprocessor systems.
An object listening on the timing_model interface is presented with memory transactions before they have been executed, and may therefore change both their semantics and their timing. Here is a list of changes that a timing model is authorized to perform:
SIM_mem_op_may_stall
Before attempting to stall a memory transaction, the timing model should call this function to check if a transaction is stallable. Typically only the first memory operation of a complex instruction is stallable. Page-crossing transactions and page-table walks are unstallable too. The timing model could accumulate stall time for these and stall after the current instruction has completed instead, see the SIM_stall_cycle function.
SIM_set_mem_op_reissue
If set, and the memory hierarchy is stalling, the memory transaction will be sent again to the timing model after the stalling was performed. If not set, the transaction will be executed without further calls to the timing model.
SIM_mem_op_ensure_future_visibility
If called, the transaction will not be cached in the STCs, ensuring that the next access to the same memory area will be sent to the timing model. Otherwise the next access to that area of memory may not be sent to the memory hierarchy at all. The address granularity for this purpose is given by the min_cacheline_size processor attribute, and is always a power of 2 no greater than the MMU page size.
Memory Store Value
Since the memory operation has not been executed yet, it is possible to change the value of a store operation in the timing model. However, it is important to restore the original value in the snoop device once the operation has been performed. The SIM_get_mem_op_value() and SIM_set_mem_op_value() functions (and their variants) can be used to get and set the value of a given memory transaction.
Stalling the Memory Transaction
When an object attached to the timing_model interface receives a memory-transaction, it is allowed to modify the timing of the transaction by returning a stall time (as a number of processor cycles). This behavior is a key to modeling caches and memory hierarchies in Simics.
By returning a non-zero number of cycles from the operate() function, Simics will stall the memory transaction that was passed as argument for that amount of time.
If a zero stall time is returned, some additional operations are allowed:
Sim_PE_No_Exception). void * pointer is not touched by Simics during the memory operation execution. It can be used to pass information from a timing model to a snoop device. A transaction may go through several memory-spaces in hierarchical order before being executed. Each of these memory-spaces may have a timing-model connected to them. However, if the transaction is stalled by one timing model, other timing models connected to other memory spaces may see the transaction being reissued before it is executed. It is not supported to return a non zero stall time from these other timing models, that is, a transaction may be stalled by at most one timing model.
An object listening on the snoop_memory interface is presented with memory transactions after they have completed. It cannot influence the execution of the operation and it may not return a non-zero value for stalling, but it is allowed to modify the value of the memory operation. Since the data returned by read operations are available at this stage, the snoop device is also an ideal place to trace memory transactions. Note that if you want to modify the properties of the memory transaction, such as future visibility and reissue, you have to do that in a timing_model interface operate function.
The following actions are allowed:
SIM_get/set_mem_op_value() functions. All types of cache modeling features are not supported by all processor types. The instrumentation API need to be supported in order to do cache modeling for a specific processor.
Currently ARC, ARM, MIPS, PPC, X86 and Xtensa target architectures support instrumentation.