This workload tuning guide describes the best known practices to optimize performance on Intel Xeon CPUs when running Apache Kafka. Default configurations may vary across hardware vendors, thus this guide helps provide a set of recommended settings for getting the best performance throughput/latency. This document assumes the user is running Kafka in cloud instances, with a section recommending settings for single node benchmarking at the end of the document.
This document is organized with the following topics:
- Document Nomenclature
- Kafka Cluster Topology
- Hardware Configuration Recommendations
- Operating System, Kernel, & Software Configuration
- Kafka Cluster-wide Configuration
- Kafka Controller Configuration
- Kafka Broker Configuration
- Kafka Producer Configuration
- Kafka Consumer Configuration
- Measurement Process
- Single Node Configuration
- Example System Startup Script
Document Nomenclature
This document uses the following terminology:
- Client: Applies only to client systems running the load generator like
kafka-producer-perf-test, or other benchmarks. Clients can be either Producers or Consumers - Server: Applies only to server systems running the Kafka brokers
- Single node: Applies only to systems running Kafka brokers in one socket and producers in another socket for benchmarking in a single bare-metal system
- Cloud: Where applicable, notes differences between bare-metal and cloud instances
- Message or Record: Used interchangeably, a message or record is a key-value pair stored by Kafka. The value represents the message contents and the key may be empty as is frequently the case in benchmarking Kafka
- Topic: In a Kafka cluster, the top-level logical division of data where a message is sent to a specific topic
- Producer: In a Kafka cluster, the producer sends messages to the Kafka cluster on a given topic
- Partition: Logical subdivision of a topic. Partition count can be set at topic creation or use defaults from Broker configuration. Messages sent to a given partition maintain temporal ordering. The specific partition can be chosen by a producer at send time or can be selected round-robin.
- Consumer: In a Kafka cluster, the consumer reads messages from one or more partitions and one or more topics
- Controller: The Kafka server that keeps track of cluster members, topics, and partition locations. Controllers can operate as a stand-alone controller or also participate in the Kafka cluster as a broker.
- Broker: The Kafka server process which receives messages from producers and stores them until they are read by other brokers or consumers
Kafka Cluster Topology
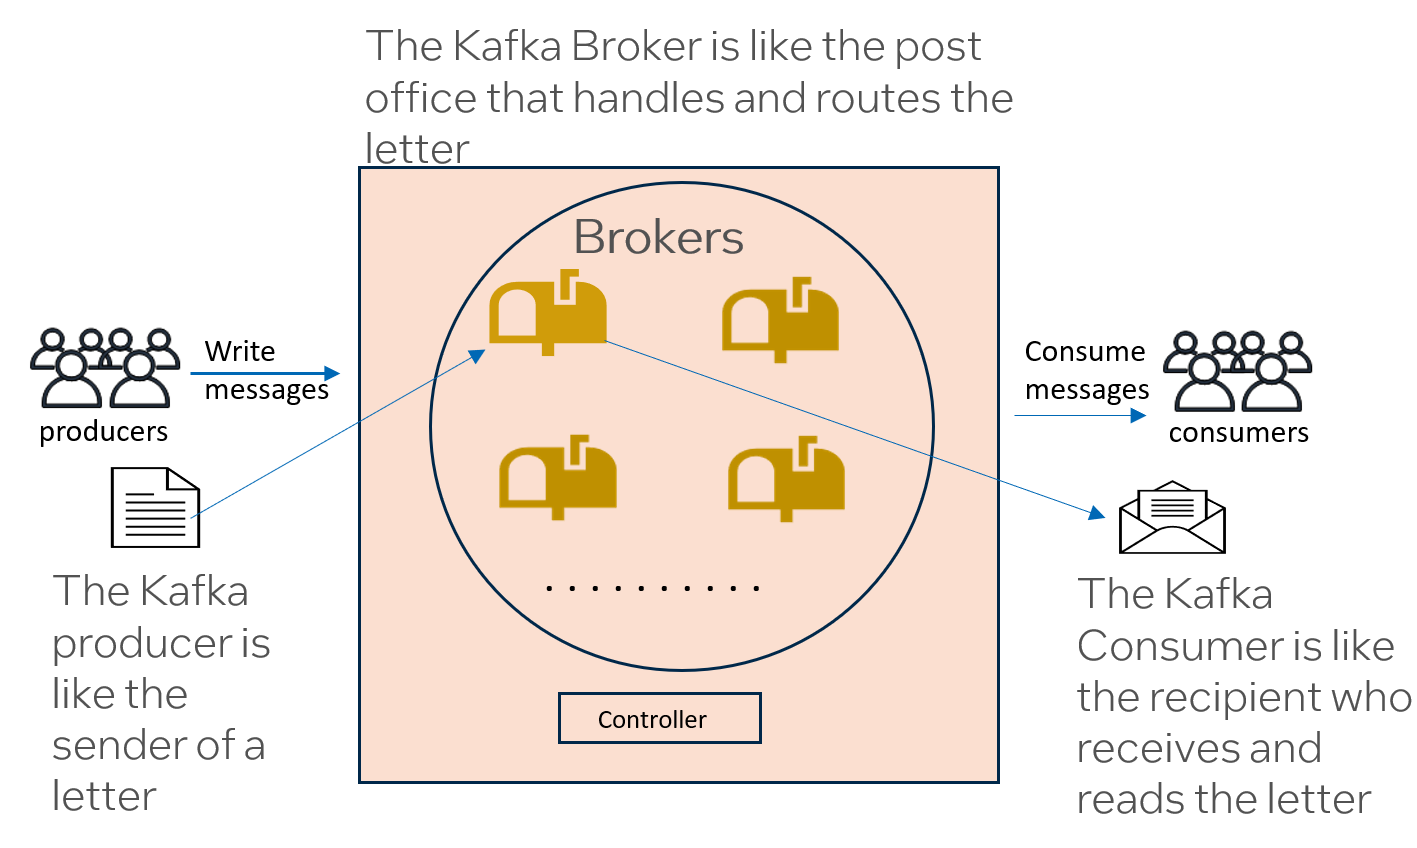
For Kafka 4.0+, a Kafka cluster consists of a set of brokers, at least one controller which may also function as a broker, producers, and consumers. When testing Kafka in a single system, broker and producer performance may be isolated by pinning each process to separate CPUs. In a cloud deployment, each broker resides in its own instance and a single instance can serve as the load generator and run a set of producers. The Kafka workload is an I/O-intensive workload meaning it needs high performing networking and storage subsystems for good performance. Cloud deployments often enable selecting instances with higher performance or configuring select subsystems like storage for higher performance. Where possible, instances should be selected with enhanced networking and storage.
Data Movement in Kafka
Understanding how data flows through a Kafka cluster is essential for optimizing performance. The data movement involves producers, brokers with partition leaders and followers, and consumers.
Producer Write Path
When a producer sends a message to Kafka:
- Partition Selection: The producer determines which partition to send the message to. This can be done explicitly by the producer, based on a message key (which is hashed to select a partition), or via round-robin distribution if no key is provided.
- Leader Identification: Each partition has one leader broker and multiple follower brokers (replicas). The producer sends the message to the leader broker for that partition.
- Leader Write: The leader broker receives the message and writes it to its local storage (log segment).
- Replication: The leader then replicates the message to the follower brokers. Follower brokers fetch new data from the leader to maintain an up-to-date copy.
- Acknowledgment (acks): Depending on the producer’s
acksconfiguration, the leader responds to the producer:acks=0: No acknowledgment (fire and forget)acks=1: Leader acknowledges after writing to its own logacks=all(or-1): Leader waits for all in-sync replicas (ISR) to acknowledge before responding to the producer. This provides the strongest durability guarantee but adds latency as replication must complete.
The producer request latency is composed of the time to generate the message, send it to the broker, replicate it among brokers in the ISR, and receive the acknowledgment from the leader broker. Replication is often the slowest part of producing a message, particularly when acks=all is configured.
Consumer Read Path
Consumers read data from Kafka brokers:
- Partition Assignment: Consumers within a consumer group are assigned specific partitions to read from. Each partition is consumed by exactly one consumer within the group, enabling parallel processing.
- Fetch Requests: Consumers send fetch requests to the leader broker of their assigned partitions (though followers can also serve reads in some configurations).
- Offset Management: Consumers track their position in each partition using offsets. The consumer commits offsets periodically to Kafka, allowing it to resume from the last committed position after a restart.
- Data Delivery: The broker returns batches of messages to the consumer, which then processes them according to the application logic.
Partition Leaders and Followers
Each partition maintains a leader broker and multiple follower brokers (replicas). The leader handles all read and write requests for the partition, while followers replicate data from the leader to provide redundancy. If a leader fails, one of the in-sync replicas (ISR) is elected as the new leader, ensuring high availability. The replication factor (typically 3) determines how many copies of each partition exist across the cluster, balancing data integrity with storage and network overhead.
Cloud Topology
When deploying Kafka in cloud environments, the cluster components are distributed across separate instances to isolate workloads and enable independent scaling. The following describes the general guidance for each component type and their resource requirements:
- Controller: One Kafka controller (non-data-broker) running in a small instance with at least 4 vCPUs. For smaller clusters, the controller process can colocate on a broker or producer node. Larger clusters with many topics may require additional controllers.
- Brokers: Start with four or more Kafka brokers to enable sufficient replication and load distribution. Each broker should run on a medium instance with approximately 16 vCPUs. Brokers can scale out to handle higher load on the cluster by adding more broker instances, or scale up by moving to larger instance sizes with more vCPUs and memory. The broker count should be chosen based on expected throughput, partition count, and desired replication factor.
- Producers: Producer processes running on large instances with high vCPU counts (80-100 vCPUs) to enable producer scale-up with minimal resource constraints. Increase the count of producer processes running on these systems until the cluster reaches the desired SLA. If producer instances approach saturation of CPU, storage, or network resources, additional instances may be added to scale out the producer capacity.
- Consumers: Consumers are optional when running benchmarks but increase the load on the Kafka cluster for more realistic testing. Consumer processes should run in a consumer group to evenly distribute the work of reading a topic. Consumer instances should be relatively large but typically don’t need as many CPU resources as producer instances.
For all instance types, select configurations with enhanced networking and high-performance storage where available, as Kafka is an I/O-intensive workload that benefits significantly from these optimizations.
Figure 1: Kafka Topology
Example: AWS Deployment
This section provides a concrete example of the cloud topology using AWS infrastructure and instance types.
- Controller: One controller process running on the producer node (or a dedicated m8i.xlarge instance for larger clusters). Larger clusters with many topics may require additional controllers.
- Brokers: Four Kafka brokers, each running on m8i.4xlarge instances (16 vCPUs, Intel Xeon-based), each with GP3 storage configured for at least 4000 IOPS and 1000 MBps throughput. Additional brokers can be added to scale out the system, or brokers may be moved up to larger instances (e.g., m8i.8xlarge or m8i.16xlarge) for scale up.
- Producers: Producer processes running on an m8i.24xlarge instance (96 vCPUs). Increase the count of producer processes running on this system until the results of the producer performance test reach the desired SLA. If the producer instance approaches saturation of CPU, storage, or network, additional m8i.24xlarge instances may be added to scale out the producers.
- Consumers: Consumer processes can run on m8i.12xlarge or similar instances, which provide sufficient resources without the full scale of producer instances.
The m8i instance family uses Intel Xeon 6 (Granite Rapids) processors. For cost optimization, newer generation instances (m8i) typically provide better performance than older generations (m7i, m6i, m5) due to CPU improvements with each generation.
Hardware Configuration Recommendations
CPU
If a Kafka cluster has a specific SLA that it must meet, the Broker nodes should not run at 100% CPU utilization at the risk of increasing latency. Since Kafka is so I/O heavy, a broker’s storage and network subsystems are often near full utilization with a somewhat underutilized CPU when a Kafka cluster meets the desired SLA. Additionally, a single Kafka broker does not scale well beyond a single NUMA node or socket so care should be taken when sharing those resources among a set of brokers.
Finally, newer CPU generations typically offer higher performance than older generations due to CPU enhancements with each generation. For that reason, it’s recommended to use instances with at least 8vCPU, 16vCPU preferred. General-purpose Intel-based systems with 16 vCPUs offer a good compromise of CPU and memory resources for broker workloads. On AWS, instances like m8i.4xlarge (Intel Xeon 6) provide better performance than older generations like m7i or m5. Use the latest generation CPU when possible because newer CPU generations have new instructions that can improve encryption and compression performance.
When benchmarking Kafka, CPU resources should always be monitored to ensure the Kafka process is not limited by available CPU.
Memory
The main job of Kafka brokers is to receive and store messages until they’re needed. Kafka heavily utilizes the filesystem page cache and its behavior of holding files in free memory until they need to be written back to improve fetch performance for recent messages. For this purpose, any additional free memory, not used by the Kafka JVM, may be utilized as page cache, so additional memory is usually beneficial for Kafka.
Network
In cloud deployments, resources such as network and storage bandwidth are limited based on the instance used. When network bandwidth is a limiting resource, many clouds offer network-enhanced instances with higher allotments of network bandwidth. Since Kafka is such a network-intensive workload, it’s recommended to use these network-optimized instances when possible. Similar to the CPU, network resources should be monitored with telemetry tooling to ensure they are not limiting Kafka performance. If any members of the cluster are close to their Network throughput limits, depending on which instances are limited, consider scaling out the cluster by adding more brokers or producers to distribute the network load.
Storage
Another potential resource bottleneck in a cloud deployment can be the storage bandwidth of volumes in their default configuration. It’s usually possible to increase the I/O operations per second (IOPS) and bandwidth for a volume at creation time. It’s recommended that these volumes be configured with high IOPS and throughput where possible. If storage performance of a single volume that’s been configured for maximum throughput is still insufficient to meet an SLA, additional volumes may be attached to brokers or the brokers may be moved to instances with direct-attached NVMes. As with other system resources, storage telemetry should be monitored to ensure individual devices are not operating beyond their allotted steady-state performance. Scaling storage when hitting instance resource limits is somewhat more flexible than scaling the network because, in addition to the possibility of growing the cluster capacity with scale-out of additional brokers, additional storage volumes can usually be added to brokers to increase their storage capacity. An alternative to adding volumes would be to scale up the brokers to systems with direct-attached NVMes that enable high-performance storage.
Operating System, Kernel, & Software Configuration
We recommend using the latest LTS version of Linux OS and kernel with current security and performance patches applied. We describe specific versions of Kafka and Java for testing and compatibility.
- Kafka version: Kafka 4.2.0 is used for this guide as it includes an enhancement to the producer performance test that enables a warmup period before collecting steady-state statistics.
- Java version: Java version 17 or 23 are officially supported by Kafka 4.2.0. Do not use Java 8 because it has been deprecated since Kafka 4.0. Additionally, Java 11 is not recommended due to incomplete support for Kafka Connect and Kafka Server. See Compatibility for further information.
Operating System Settings
In this section, we describe some Linux operating system settings that can help optimize storage and networking resources to improve Kafka’s request latency performance.
Operating System Tuning
The Linux adaptive tuning system tuned can automatically apply tuning to the operating system based on profiles designed to optimize latency, throughput, power savings, or other goals. For Kafka, we use tuned to apply the latency-performance profile to improve the response time of Kafka brokers and minimize request latency.
# systemctl enable tuned.service; systemctl start tuned.service; tuned-adm profile latency-performanceAnother system-tuning tool used to improve the latency of Kafka is the tool perfspect. Perfspect is a multifunction tool that can be used to gather system metadata and telemetry as well as view and change various system configuration parameters. In the case of Kafka, we use perfspect to apply thelatency-optimizedprofile to the Efficiency Latency Control (ELC) system. ELC is only available on Intel Xeon 6 family of CPUs comprising Granite Rapids processors (e.g., AWS m8i series, GCP C4 series).# perfspect config --elc latency-optimized
Storage Options
Mounting Volumes
Since Kafka is an I/O heavy workload, we want to minimize unnecessary I/O when possible. One way to do this is to use the flags noatime and nodiratime when mounting volumes to an instance. These flags prevent the filesystem from modifying the access time metadata for files and disks, thereby removing these disk operations. These can be applied as mounting flags in fstab or in an ad hoc mount command
mount -o noatime,nodiratime <storage identifier>
Enable Frequent Write-back to Storage
High storage latency tends to increase the latency of producer requests as the broker’s I/O path becomes congested.
Under normal operation, Kafka constantly receives data and writes it to storage.
When storage subsystems are heavily utilized, write-back events where large quantities of data are sent to storage tend to have higher latency than smaller write-backs. To minimize the volume of data written back to storage at each event, we can decrease the amount of data that will sit in the page cache before a write-back is triggered, known as vm.dirty_background_bytes. This will cause the kernel to write-back to storage more frequently as this smaller cache fills up. While this will utilize more of the CPU in the kernel context, reduces spikes in write bandwidth, IOPS, and disk latency which helps to improve Kafka’s request latency. To choose a good value for dirty_background_bytes, the user should inspect the output of iostat to observe how write latency, bandwidth, and IOPS change.
- Example: for an instance, with 16 GB of system memory, 400MB would represent about 2.5% of its 16 GB memory. This can be read and written with
sysctlor echo’d into the proc fs:sysctl -w vm.dirty_background_bytes=400000000echo 400000000 > /proc/sys/vm/dirty_background_bytes
Additional Operating System Configuration
Multiple additional settings for the Linux OS can be modified from their defaults to improve Kafka performance. See the example at Example System Startup Script
Kafka Cluster-wide Configuration
Settings in this section apply to all members of the Kafka cluster
Encryption
These settings enable TLS encryption, but common stores and passwords are not recommended for production clusters. For more information, see Encryption and Authentication using SSL
ssl.enabled.protocols=TLSv1.2,TLSv1.3- Common truststore (copy) between brokers and clients
- Common keystore (copy) between brokers and clients
- Common passwords for
ssl.keystore.password,ssl.key.password,ssl.truststore.password ssl.endpoint.identification.algorithm=(empty for simplified authentication)
Kafka Controller Configuration
- At least one Controller running in KRaft mode
- Controller doesn’t participate in the cluster to separate the controller workload from the broker message-processing workload
process.roles=controller
- Most other Controller settings can be defaults
Kafka Broker Configuration
- Kafka 4.2.0 (containing warmup patch from KIP-1052)
-
[Downloads Apache Kafka](https://kafka.apache.org/downloads)
-
- Threads: Increase network and replica fetcher threads since replication is the slow part of producing a message. Increase socket receive and socket send buffers to minimize dropped packets at the network.
- Example: Cloud instance with 16 vCPUs
num.network.threads=6: should be less than or equal to half the CPU cores assigned to a brokernum.io.threads=8: should be less than or equal to the count of CPU cores assigned to a brokernum.replica.fetchers=2: increased beyond the default of 1 to improve replication latencysocket.receive.buffer.bytes=102400000: Increased to 100MB from the default of 100kB to improve network performancesocket.send.buffer.bytes=102400000: Increased to 100MB from the default of 100kB to improve network performance
- Example: Cloud instance with 16 vCPUs
- Broker Heap Size: Set the Java heap to at least 4GB and prevent the heap from growing or shrinking by using the same value for its minimum size:
export KAFKA_HEAP_OPTS="-Xms4G -Xmx4G"
- Broker Java EXTRA_ARGS:
"-name kafkaServer -loggc -Xlog:gc* -XX:+PrintFlagsFinal -Xlog:safepoint,gc*,gc+ergo*=trace,gc+age*=trace,gc+phases*=debug:file=$KAFKA_GC_LOG -XX:+AlwaysPreTouch -XX:+UnlockExperimentalVMOptions -XX:G1ReservePercent=2 -XX:G1NewSizePercent=50 -XX:G1MaxNewSizePercent=100
Kafka Producer Configuration
Producer Java Configuration
When running concurrent Producers on systems with high core counts like an instance with 92 vCPUs, it’s important to limit each JVM’s access to Garbage Collection (GC) threads so they don’t each attempt to use all the vCPUs in the system. Producers reading from payloads should also increase their heap size to store the payload.
- Each producer only needs a handful of threads for effective GC, so add this to the producer’s Java command line:
-XX:ParallelGCThreads=5"
- Export this environment variable to set the producer to use a 1GB heap and don’t grow or shrink the heap:
export KAFKA_HEAP_OPTS="-Xms1G -Xmx1G"
Payload
When running the kafka producer performance test, producers may generate random messages on demand or read messages from a payload. Utilizing a payload improves producer efficiency. This ensures that the test is only limited by the performance of the Kafka cluster, rather than the producers themselves.
For a production cluster, Kafka will usually use a schema to enforce data structure. These data are serialized by producers into a Kafka Message and sent to the cluster. For benchmarking, it’s best if a payload can be assembled from data that resembles production data, but a payload of a consistent record size can be useful to assess cluster performance under more controlled conditions.
Absent production data, data that can be compressed with a compression ratio similar to production data can be a good proxy for a benchmark. A very simple payload file can be constructed with messages delimited by a special character that should not appear in the text such as a pipe character, “|”. Further information for designing realistic production-quality payloads can be found here Tips for designing payloads.
Topic Configuration
Although brokers can set defaults for the following configurations in their server.properties config file, these settings are often set for a given topic when it is created.
Replicas=3- A leader and two followers will each hold a copy of a given partition. As the number of brokers in a cluster increases, the work of replication is spread out across the available brokers. To ensure data integrity, a replication factor of at least 3 should be used.Partitions=8- Partitions are evenly divided among the available brokers in the cluster. More partitions can increase parallelism and throughput for both producers and consumers. Partitions also consume compute and file resources on Brokers so high partition counts may need additional tuning for good performance. To better understand benchmarking results, the number of partitions can be set as a multiple of the number of brokers to ensure even division of work across the brokers.compression.type=zstd- zstd usually has the highest throughput of the available compression options and is typically recommended for latency-sensitive environments (good balance between compression speed and compression ratio)
Kafka Consumer Configuration
While not strictly necessary to measure Kafka producer performance, when testing end-to-end latency of the path Producer -> Kafka Broker -> Consumer, Consumer clients can read data from brokers that contain data on their topic of interest. It should be noted, however, that the Kafka Consumer test does not spend time processing the messages, so they will not add load mimicking “real consumer latency”, but will increase the Fetch and network load on the brokers. Consumers of a given topic that are collaborating on their ingestion of that topic should participate in a Consumer Group so they can evenly share the processing of that topic’s data. The number of Consumers in a group should be tuned to their ability to ingest data from the shared topic. That is, if a given consumer can ingest more than one partition concurrently without adding latency to the operation, the partitions can outnumber the Consumers. The number of Consumers in a consumer group attached to a given topic should not exceed the number of partitions in that topic, else the additional consumers in the group will sit idle. Multiple Consumer processes may share a large system that is configured similarly to a producer instance.
Measurement Process
Benchmarking Kafka is typically accomplished with the kafka-producer-perf-test.
In this test, the producer sends data to Kafka on a specified topic at a provided rate for a provided number of records.
This test measures the latency of a producer request which is composed of the producer generating a message, sending the message to the brokers, the message being replicated among brokers, and the response from the leader broker to the producer.
At the end of the test, the producer reports resulting statistics comprising average latency and throughput as well as median and tail latencies like p99 which is used for the SLA.
To get a more accurate measurement of a Kafka cluster’s performance during steady-state operation, utilize the warmup-records feature available in the kafka-producer-perf-test in Kafka 4.2.0.
The --warmup-records parameter instructs the producer to classify a fraction of the provided num-records as a “warmup” and keep them separate from the steady-state performance which is reported separately from the whole test in the metrics summary statistics lines printed at the end of the test run.
In choosing the test duration, num-records, the test should be long enough to get sufficient repeatability in the steady-state p99 measurements.
A warmup allows some time for the broker and producer JVMs to warm up, network connections to be established, and variability from these changes to reach equilibrium as the cluster reaches steady state.
Often, one minute of warmup is sufficient for these purposes so warmup records should be set based on the producer throughput requested and should be tested iteratively to ensure producer throughput and latency are consistent during steady-state operation.
Message Batching
When configuring the producer’s sending behavior, two important items stand out to control the flow of data from the producer: batch size and linger. These can be specified in the producer’s configuration file producer.properties or specified on the command line.
linger.ms=5- Very low linger values can influence batches to be partially filled, reducing overall bandwidth, whereas high linger values can increase request latencybatch.size=114688- For our text-based corpus (Shakespeare), larger batches achieve better compression ratio, but can increase batch record-queue-time, since it takes longer to fill the batch at a given rate of message production. These statistics can be viewed in Producer metrics & JMX ouput
An example producer perf test command line is as follows:
$ kafka/bin/kafka-producer-perf-test.sh --topic test-PR78-BR4-PA32-R3 --bootstrap-server 127.0.0.1:9093 --num-records 15000000 --warmup-records 3000000 --payload-file /opt/kafka/kafka-payload.txt --payload-delimiter '\|' --throughput 50000 --print-metrics --producer-props compression.type=zstd acks=all batch.size=114688 linger.ms=5 --command-config /opt/kafka/kafka/config/producer.properties
In the command line above, we have a single producer, sending messages from the kafka-payload.txt to a topic named “test-PR78-BR4-PA32-R3”. One of the brokers in the cluster is located at the bootstrap-server IP address and listening on port 9093, per its configuration. The producer will send 15M records at a rate of 50k records/second. The first 3M of these records will count as warmup records, where the warmup will last approximately 60 s. This producer will print a summary or internal JMX metrics at the end of the test. The producer will send data with zstd compression, and request acks from all brokers once they have a replica of the message. The producer will wait up to 5 ms to accumulate messages into a batch of size no greater than 112kB, before sending a batch of messages to a single broker. Monitor the output of the producer performance test to determine if a longer warmup is needed.
Throughput Sweeps
To determine the throughput at which a given cluster hits a desired SLA such as “p99 latency must be less than or equal to 20 ms”, we run kafka-producer-perf-test.sh with an increasing number of producers until the resulting p99 is at or just below the SLA.
This gives us our desired key performance indicator (KPI) of “cluster throughput at SLA”.
To improve the consistency of the measurement, each producer should send data to the specified topic at the same rate, 50k records/sec in this example.
In the figure below, we have the results of a sweep as described above, showing p99 latency for each load level. The figure shows cluster throughput at 20 ms SLA to be approximately 350k records/sec.
Example Latency vs Throughput Curve (p99 Latency)

p99 Latency
(ms)
  40│
    │                                   ●
  35│
    │                                ●
  30│
    │                            ●
  25│
    │                         ●
  20│─ ─ ─ ─ ─ ─ ─ ─ ─ ─ ─ ●─ ─ ─ ─ ─ ─ ─ ─
    │
  15│                   ●
    │                ●
  10│             ●
    │          ●
   5│   ●   ●
    │
   0└─┴─────┴─────┴─────┴─────┴─────┴─────┴
     0    100   200   300   400   500   600
      Cluster Throughput (1000 records/sec)

     ● = Measured data point
     ─ = SLA threshold line at 20ms
Evaluation of Performance and System Health
When benchmarking, we should always pay close attention to the resources used on the system(s) under test (SUT). Once we’ve identified our SLA throughput, it’s wise to examine the system resources for the test at that throughput to ensure that the performance is not limited by configuration or a particular system resources. Many tools are available to monitor the system including perfspect and SAR which can both gather metrics from Linux that monitor important system resources such as CPU, storage bandwidth, storage IOPS, storage latency, and network bandwidth.
One important analysis is to inspect the CPU utilization of the brokers and producers to ensure that high CPU utilization is not limiting producer scaling or broker performance. If their CPUs are above 80% utilized, there is likely some performance reduction so the cluster admin should consider scaling out the cluster or scaling up the individual systems.
This same analysis should be performed for storage bandwidth, storage IOPS, and network to be sure the systems are not hitting their limits. For the network, the systems only need to operate under the limits allowed by the instance and consider scaling out or up if at or beyond these limits.
When operating Kafka in production, it’s often undesirable to use multiple additional telemetry tools for fear of affecting performance.
In these cases, Kafka has Java Management Extensions (JMX) metrics that can be passively gathered by Kafka and either logged or displayed on dashboards such as Grafana.
Since it’s built into Kafka and Java, JMX can offer additional insights into the internal operations of Kafka that cannot otherwise be monitored with external tooling.
To enable JMX on a Kafka process, add the JMX_PORT variable to the environment of the process.
For more info on JMX see Monitoring
Finally, if users need to better understand the call stacks of Kafka or where Kafka is spending time on CPU, tools such as flamegraphs can be extremely useful to gather and understand their call stacks. To enable flamegraphs for any Java process including Kafka, add the following arguments to the Java command line for each process:
-XX:+PreserveFramePointer -XX:+UnlockDiagnosticVMOptions -XX:+DebugNonSafepoints
Single Node Configuration
Here we discuss changes to the configuration and topology of a Kafka cluster when measuring Kafka performance of brokers running in a single system.
Single-node Topology
If running in a single physical system, arrange brokers so that they don’t interfere with each other’s performance as much as possible. The following examples demonstrate pinning Controllers and Brokers to specific CPUs in a two-socket system with 192 cores per socket (96 physical cores with hyperthreading enabled) and six NUMA nodes (3 NUMA nodes per socket, 32 physical cores per NUMA node), using Sub-NUMA Clustering (SNC) enabled.
With hyperthreading enabled, each physical core has two logical threads. The thread numbering follows the pattern where low-order CPUs (0-95) represent the first hyperthread of each physical core on socket 0, and high-order CPUs (192-287) represent the second hyperthread of the same physical cores.
- Controller: One Kafka controller (non-data-broker) pinned to socket 0, using non-specific CPUs not occupied by brokers
$ numactl -m "0,1,2" -N "0,1,2" /opt/kafka/kafka/bin/kafka-server-start.sh controller.properties …
- Brokers: Three Kafka brokers on socket 0, each pinned to a subset of cores within a dedicated NUMA node with private cores to minimize interference. Each broker uses 8 physical cores with both hyperthreads (16 logical CPUs total):
- Broker 0 on NUMA node 0 (CPUs 0-7,192-199):
$ numactl -m 0 -N 0 -C 0-7,192-199 /opt/kafka/kafka/bin/kafka-server-start.sh broker0.properties … - Broker 1 on NUMA node 1 (CPUs 32-39,224-231):
$ numactl -m 1 -N 1 -C 32-39,224-231 /opt/kafka/kafka/bin/kafka-server-start.sh broker1.properties … - Broker 2 on NUMA node 2 (CPUs 64-71,256-263):
$ numactl -m 2 -N 2 -C 64-71,256-263 /opt/kafka/kafka/bin/kafka-server-start.sh broker2.properties …
- Broker 0 on NUMA node 0 (CPUs 0-7,192-199):
This configuration assigns 16 logical CPUs (8 physical cores × 2 hyperthreads) per broker, ensuring each broker has exclusive access to its assigned CPU cores and local memory within its NUMA node, which minimizes memory access latency and maximizes performance.
Single-node Hardware Recommendations
Storage
Ensure that each broker has sufficient storage bandwidth by assigning at least one storage drive per broker. While it’s possible for brokers to share a single physical drive by using different directories for their log dirs, it is not recommended.
Single-node BIOS Configuration Recommendations
If the user has access to the BIOS for a system, here are some parameters that can be changed to improve Kafka performance.
- Sub-NUMA Clustering (SNC): enables multiple NUMA nodes so each broker can run on its own NUMA node
- Hyperthreading: enabled
- Latency Optimized mode: Some Xeon BIOS use this parameter. This setting optimizes for latency vs. power of the memory subsystem which helps latency-sensitive workloads
Single-node System Configuration
In contrast to cloud instances, physical servers can often have hundreds of gigabytes of memory installed. In these cases, it’s usually more useful to use the setting vm.dirty_background_bytes instead of vm.dirty_background_ratio since even 1% of 512 GB would be 5 GB which could cause additional latency during write-back. In such a system, even a modest size for vm.dirty_background_bytes such as 400MB can enable good performance. Note that vm.dirty_background_bytes affects all sockets and nodes in the system.
vm.dirty_background_bytes=400000000
Example System Startup Script
############################################
# recommended kernel settings #
############################################
ulimit -n 1048576
ulimit -l unlimited
ulimit -u 32768
# Disable reclaim mode, disable swap, disable defrag for Transparent
# Hugepages in accordance with DataStax
echo 0 > /proc/sys/vm/zone_reclaim_mode
swapoff –all
echo never | sudo tee /sys/kernel/mm/transparent_hugepage/defrag
##############################
# Network production settings#
##############################
sysctl -w \
net.ipv4.tcp_keepalive_time=60 \
net.ipv4.tcp_keepalive_probes=3 \
net.ipv4.tcp_keepalive_intvl=10
sysctl -w \
net.core.rmem_max=16777216 \
net.core.wmem_max=16777216 \
net.core.rmem_default=16777216 \
net.core.wmem_default=16777216 \
net.core.optmem_max=40960 \
net.ipv4.tcp_rmem='4096 87380 16777216' \
net.ipv4.tcp_wmem='4096 65536 16777216'

################################################################
# setting the system to performance mode for best possible perf #
################################################################
for CPUFREQ in /sys/devices/system/cpu/cpu*/cpufreq/scaling_governor
do
 [ -f $CPUFREQ ] || continue
 echo -n performance > $CPUFREQ
done
for CPUFREQ in /sys/devices/system/cpu/cpu*/power/energy_perf_bias
do
 [ -f $CPUFREQ ] || continue
 echo -n performance > $CPUFREQ
done
##################################################################
# Disk Optimizations for Kafka storage devices #
# - changing scheduler to none #
# - rotational to zero #
# - changing the read ahead buffer #
##################################################################
touch /var/lock/subsys/local
echo none > /sys/block/nvme1n1/queue/scheduler
echo none > /sys/block/nvme2n1/queue/scheduler
echo none > /sys/block/nvme3n1/queue/scheduler
echo none > /sys/block/nvme4n1/queue/scheduler
echo 0 > /sys/class/block/nvme1n1/queue/rotational
echo 0 > /sys/class/block/nvme2n1/queue/rotational
echo 0 > /sys/class/block/nvme3n1/queue/rotational
echo 0 > /sys/class/block/nvme4n1/queue/rotational
echo 8 > /sys/class/block/nvme1n1/queue/read_ahead_kb
echo 8 > /sys/class/block/nvme2n1/queue/read_ahead_kb
echo 8 > /sys/class/block/nvme3n1/queue/read_ahead_kb
echo 8 > /sys/class/block/nvme4n1/queue/read_ahead_kb