GPU Profiler
Usage
Intel® Extension for TensorFlow* provides support for TensorFlow* Profiler, and is enabled by exposing three environment variables (export ZE_ENABLE_TRACING_LAYER=1, export UseCyclesPerSecondTimer=1, export ENABLE_TF_PROFILER=1).
You can use the profiler to track the performance of the TensorFlow* models running on the Intel GPU.
The GPU profiler supports the following profiling items:
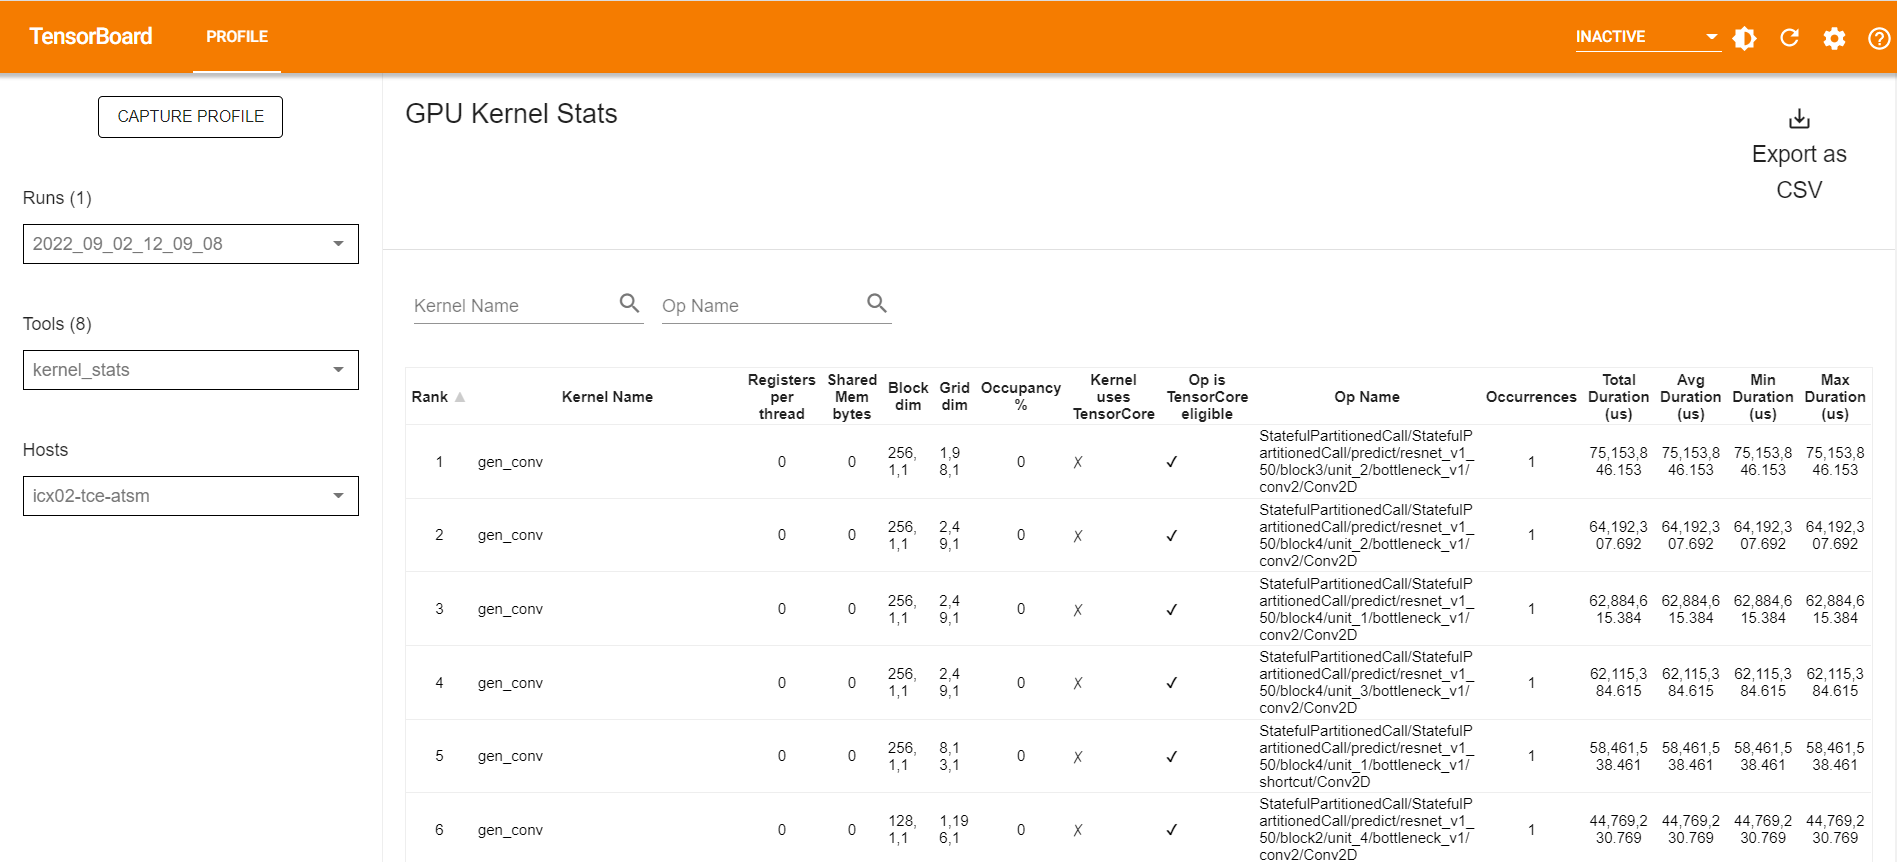
kernel_stats
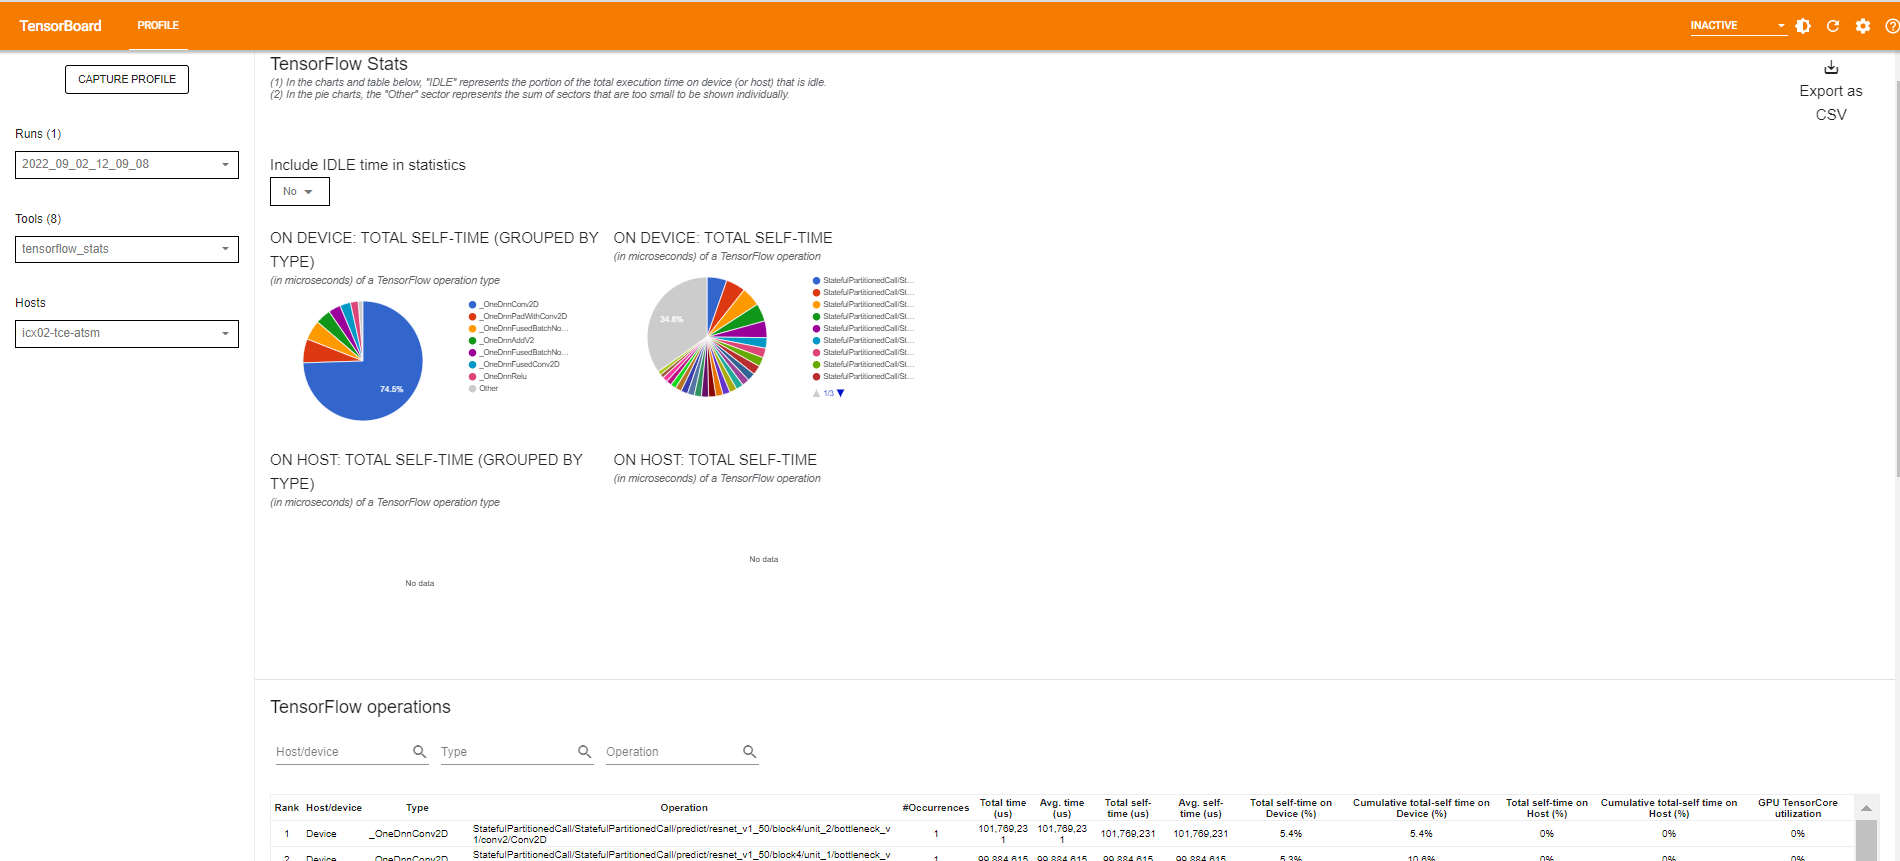
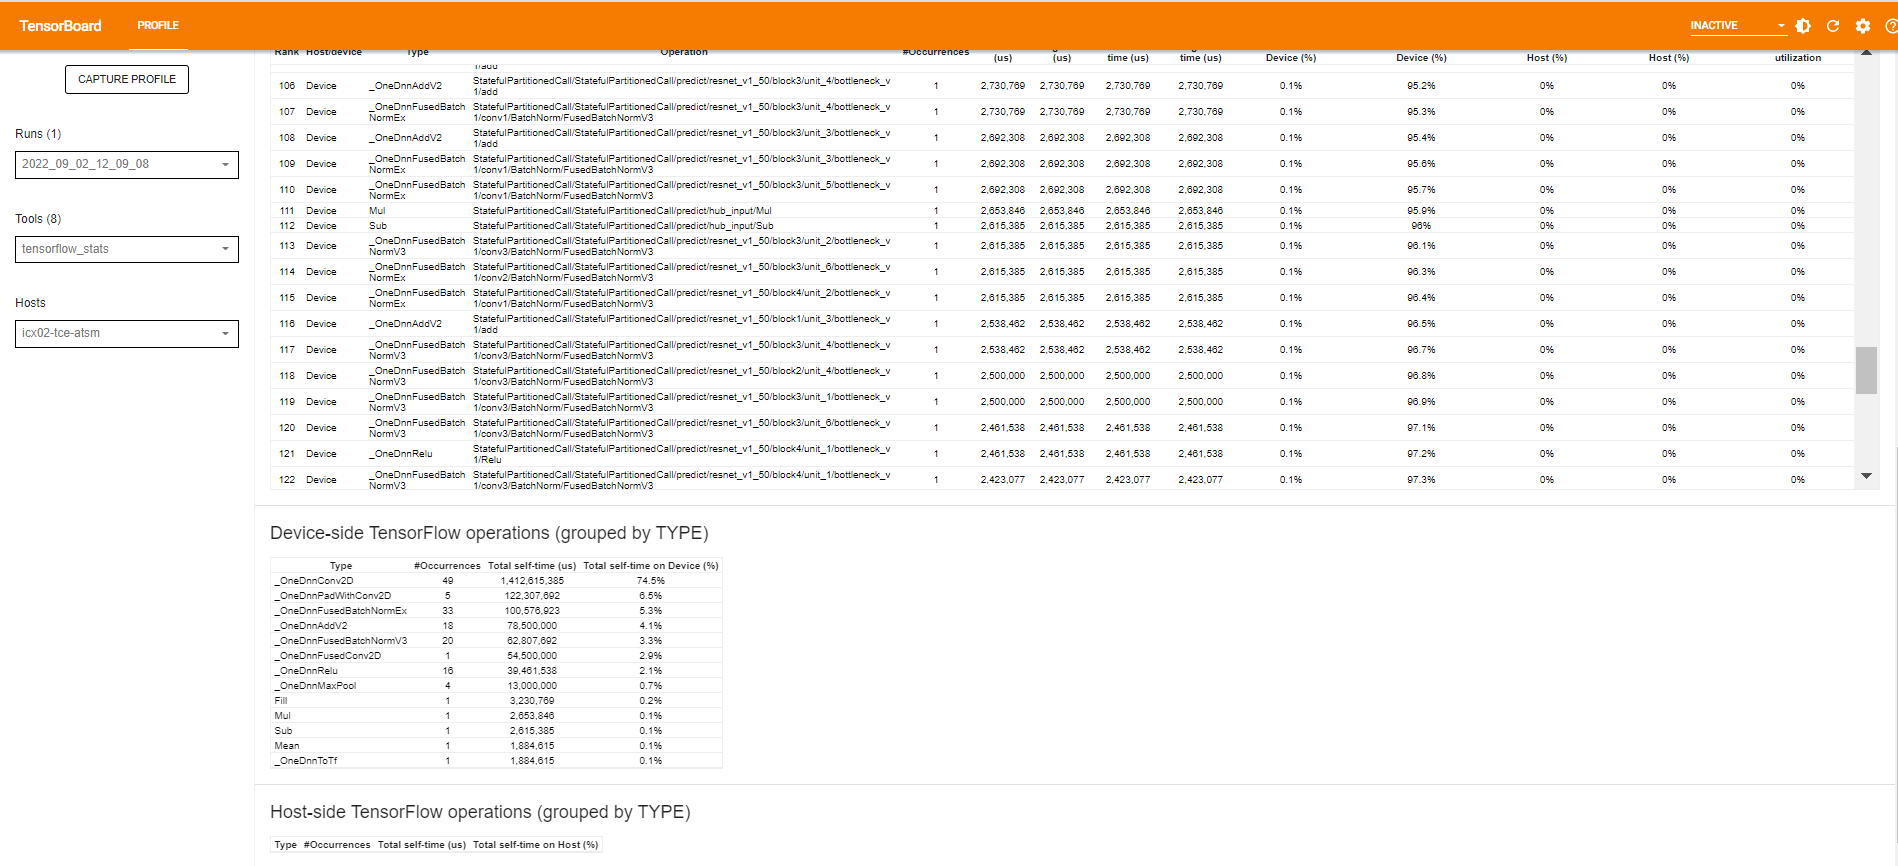
tensorflow_stats
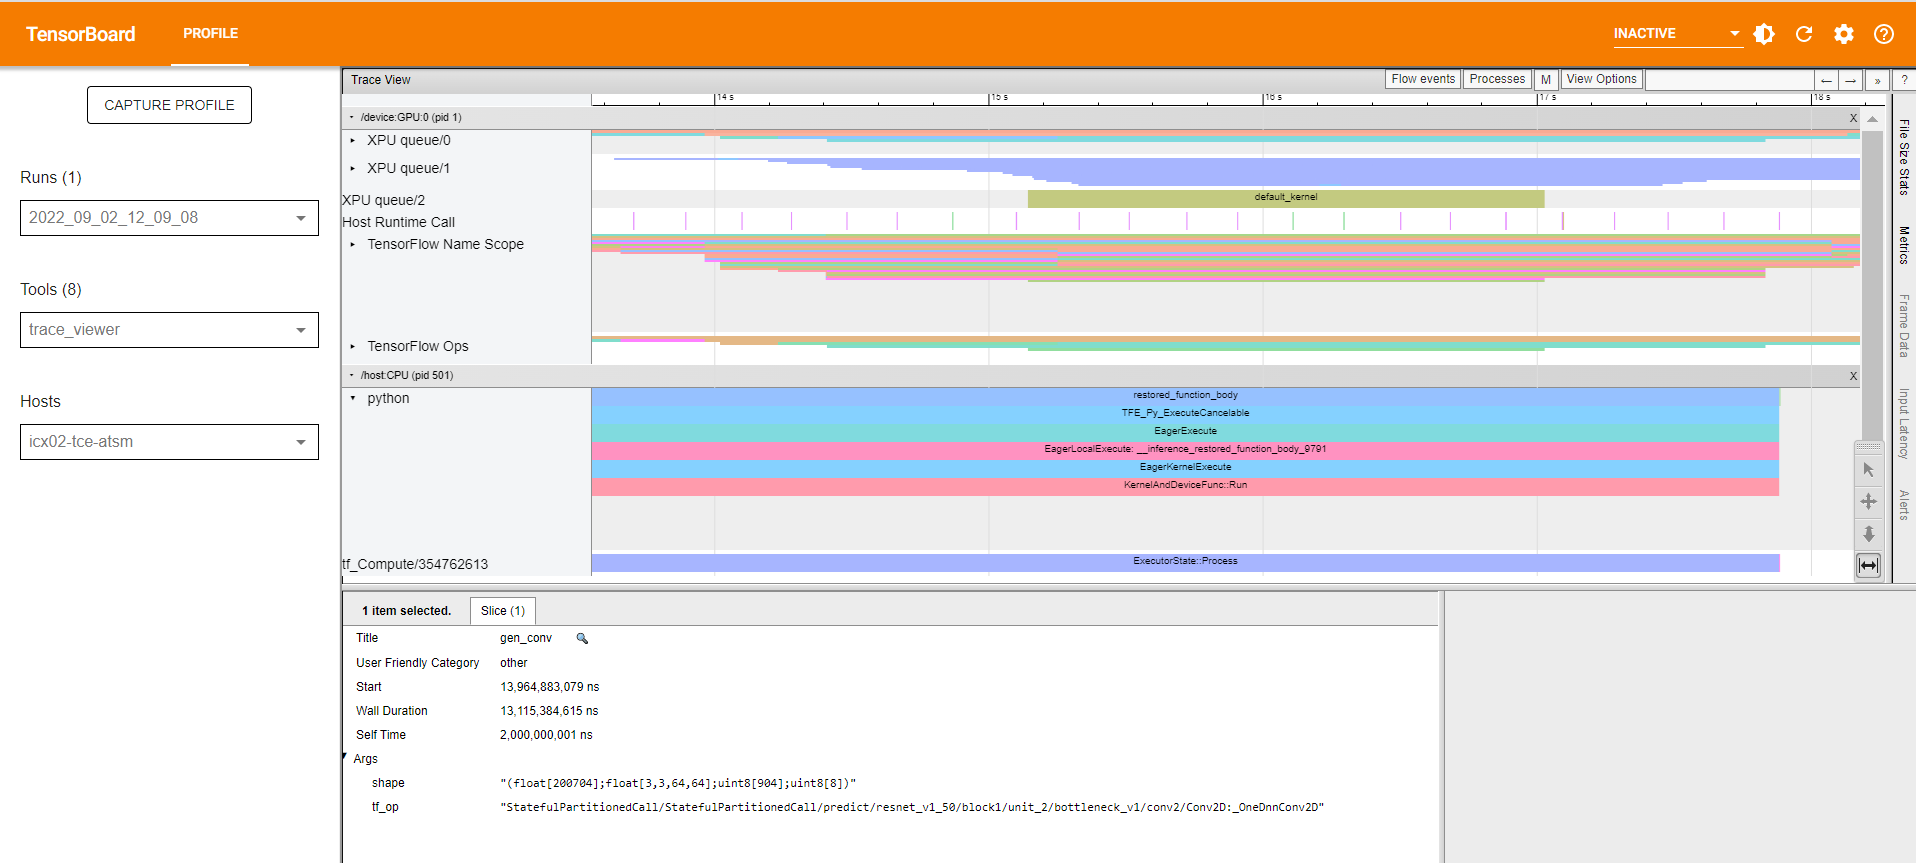
trace_viewer
Example:
requirements:
pip install tensorflow_hub
pip install -U tensorboard-plugin-profile
script:
import tensorflow as tf
import numpy as np
import os
import tensorflow_hub as tf_hub

logpath = os.path.join('data', 'logs',  'profiler_demo')
tf.debugging.set_log_device_placement(True)

model = tf_hub.KerasLayer('https://tfhub.dev/google/imagenet/resnet_v1_50/classification/5')

input = tf.ones((1, 224, 224, 3))

with tf.device("/XPU:0"):
    # Warm up
    model(input)

    tf.profiler.experimental.start(logpath)
    model(input)
    tf.profiler.experimental.stop()

print('done')
run:
$ export ZE_ENABLE_TRACING_LAYER=1
$ export UseCyclesPerSecondTimer=1
$ export ENABLE_TF_PROFILER=1
python test.py
Run TensorBoard:
After executing the above sample code, you will find the log files in ./data/logs/profiler_demo. Then, run TensorBoard with following command:tensorboard --logdir=./data/logs/profiler_demo --bind_all
Analyze the result from the Profile tab:
kernel_stats:

tensorflow_viewer:


trace_viewer:

FAQ
1.If you see “No dashboards are activated for the current data set.” the first time you enter the TensorBoard in the browser:
Refresh the page, and the profile should be shown.